

From Splunk to Sigma: Building and Validating Vendor-Neutral Detection Logic
A detection-engineering exercise using Sigma, Splunk, Windows telemetry, and Atomic Red Team to validate vendor-neutral detection logic


A detection rule can look perfectly reasonable on paper and still fail when it encounters real endpoint telemetry.
In this article I document a small detection-validation exercise I performed using PowerShell, Sysmon, Windows PowerShell logging, Splunk, and Atomic Red Team. The objective was not to build a sophisticated detection framework. Instead, I wanted to answer a practical SOC question:
If I manually generate a suspicious PowerShell behavior and then reproduce the same general behavior through an ATT&CK-mapped Atomic Red Team test, will my existing Splunk detections identify it?
The validation process followed this workflow:
Manual PowerShell test
        ↓
EncodedCommand
        ↓
Splunk detection
        ↓
Atomic Red Team T1027
        ↓
Equivalent behavior
        ↓
Does the existing detection identify it?
This exercise ultimately exposed two different aspects of detection engineering: whether the expected endpoint telemetry is generated, and whether the SIEM detection is actually searching that telemetry correctly.
Before creating a repeatable testing environment, I performed a simple baseline validation.
I manually invoked notepad.exe from PowerShell and then checked both Windows Event Viewer and Splunk to determine whether the expected events appeared.
An unexpected result occurred during this initial test. Launching Notepad interactively from Windows Explorer generated a Sysmon Event ID 1 process-creation event, while the attempted execution from PowerShell did not produce the expected process-creation result in the same way.
Rather than treating this individual application behavior as the basis for the entire validation methodology, I used it to identify a limitation of command-by-command manual testing.
The initial baseline was therefore useful, but limited.
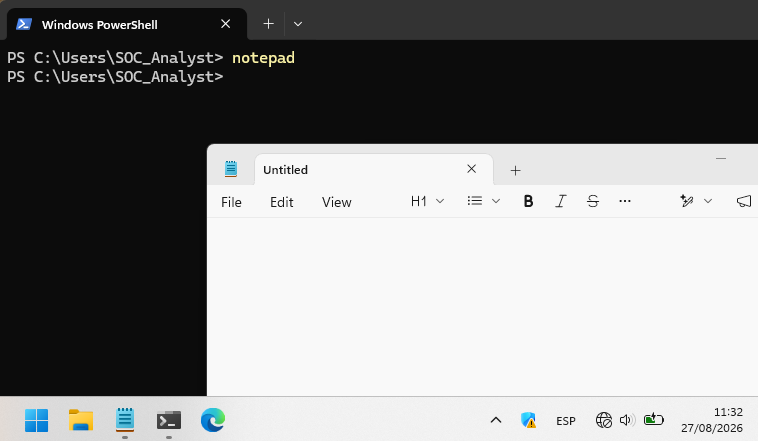
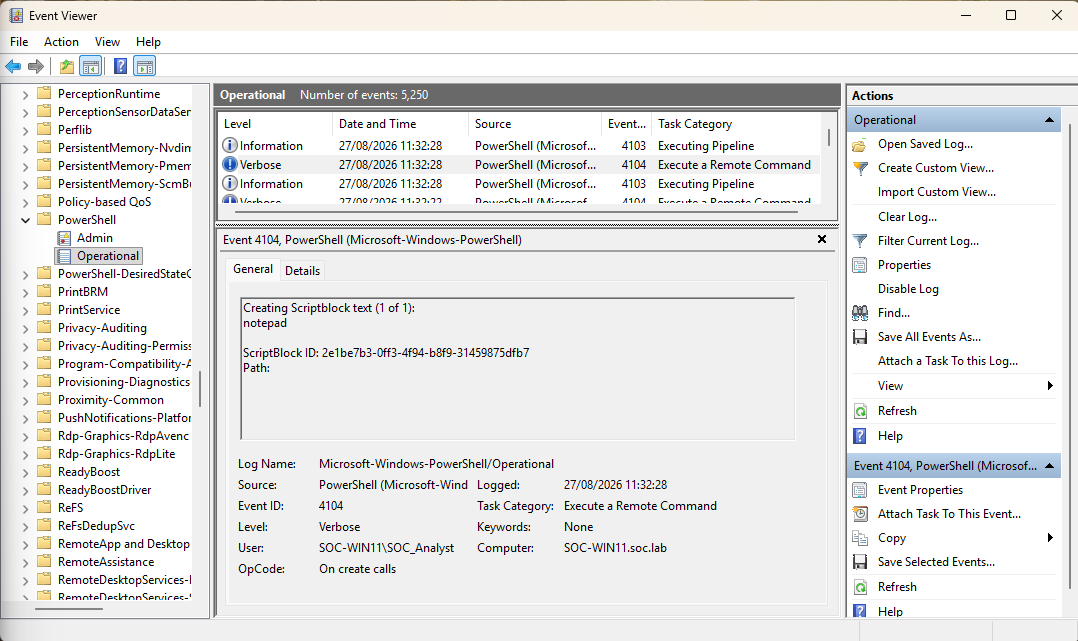
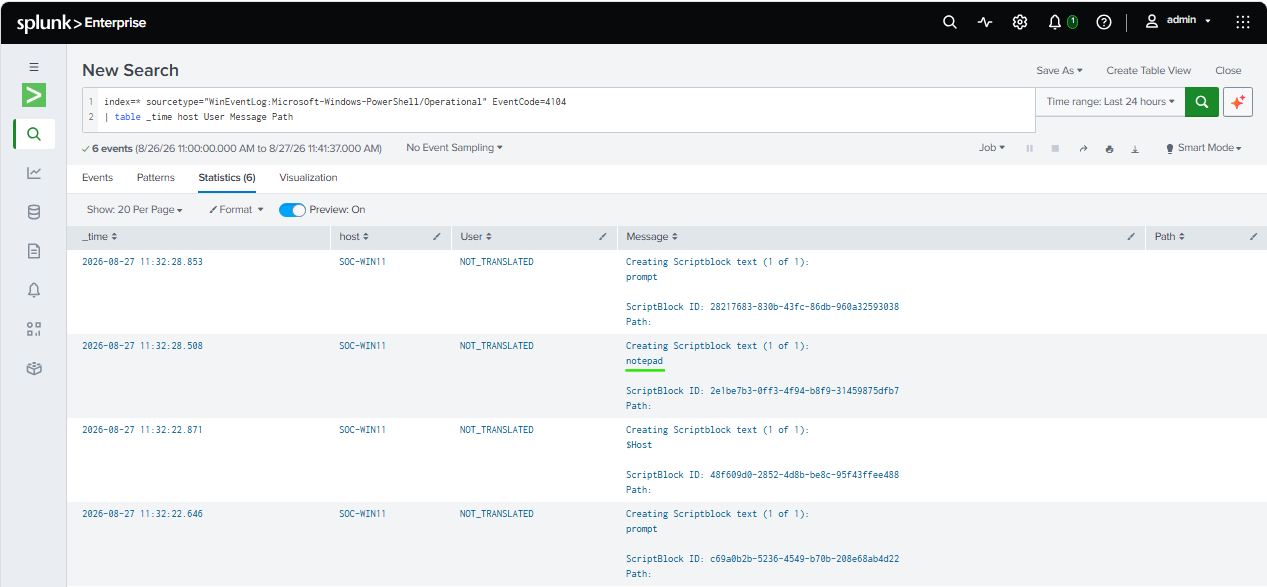
Initial manual validation of PowerShell and process-creation telemetry. The baseline demonstrated that endpoint behavior and the resulting telemetry should be validated independently rather than assumed.
The first baseline produced an interesting result:
| Telemetry | Result |
|---|---|
| Sysmon Event ID 1 | Failed to observe expected result |
| PowerShell Event ID 4104 | Successful |
The important lesson was that manual testing is difficult to repeat consistently and does not scale well when validating multiple ATT&CK techniques. I therefore moved to a repeatable testing methodology using Atomic Red Team.
For each test, I recorded three things:
This provided a simple validation chain:
Attack behavior
      ↓
Endpoint telemetry
      ↓
SIEM ingestion
      ↓
Detection logic
      ↓
Detection result
I installed Atomic Red Team and first verified the installed PowerShell version, since the official Invoke-AtomicRedTeam documentation lists PowerShell 5.0 as the minimum supported version.
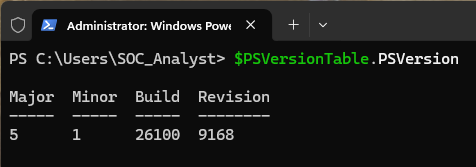
PowerShell version verification before installing and executing Atomic Red Team tests.
During installation, I encountered an important practical issue: Windows Defender blocked portions of the Atomic Red Team repository.
This is not particularly surprising for a security-testing framework. Atomic Red Team contains scripts and test artifacts that can resemble offensive tooling and may trigger endpoint security controls.
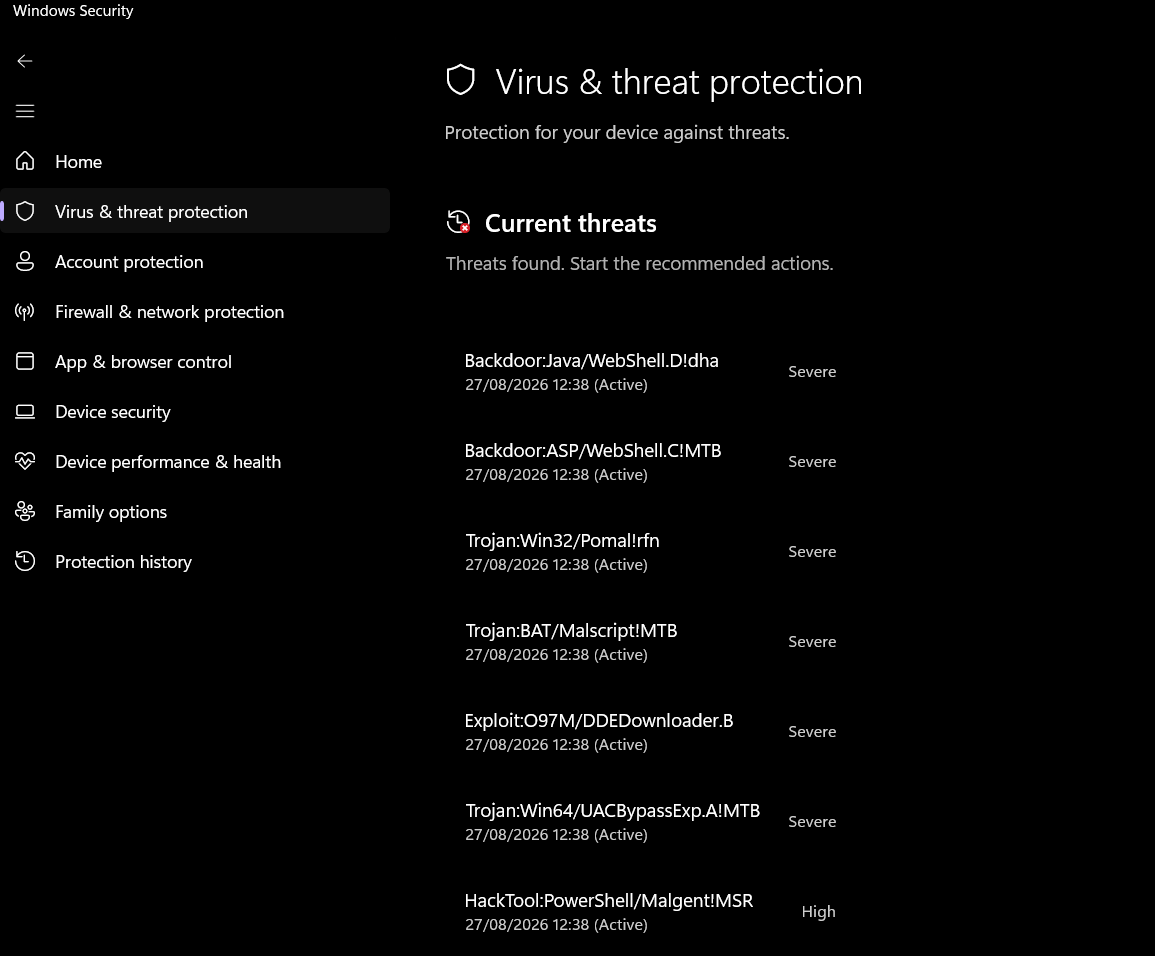
Windows Defender detecting suspicious contents after downloading Atomic Red Team
The official Invoke-AtomicRedTeam documentation also explains that files within the Atomics repository can trigger antivirus detections and supports working with individual tests rather than necessarily retrieving the entire collection.
Rather than disabling Windows Defender to install a large collection of security-testing payloads, I chose a more controlled approach: retrieve and work with only the Atomic test required for the validation.
This is also closer to how I would approach security testing in a controlled environment: minimize unnecessary changes to security controls and use only the test material required for the objective.
I selected MITRE ATT&CK T1027 — Obfuscated Files or Information, specifically Atomic Test 2, because it produces PowerShell encoded-command activity similar to the behavior I had previously generated manually.
The test definition was:
| Attribute | Value |
|---|---|
| Technique | T1027 — Obfuscated Files or Information |
| Atomic Test | Execute base64-encoded PowerShell |
| Atomic Test Number | 2 |
| Atomic Test GUID | a50d5a97-2531-499e-a1de-5544c74432c6 |
The test creates a Base64-encoded representation of:
Write-Host "Hey, Atomic!"
and executes the resulting value using:
powershell.exe -EncodedCommand
Before executing it, I reviewed the Atomic definition to understand exactly what behavior it would generate.
This is an important part of the validation process. Atomic Red Team should not be treated as a black box. A SOC analyst should understand what a test is expected to do before deciding whether the resulting telemetry represents the expected behavior.

Local Atomic Red Team test for T1027.
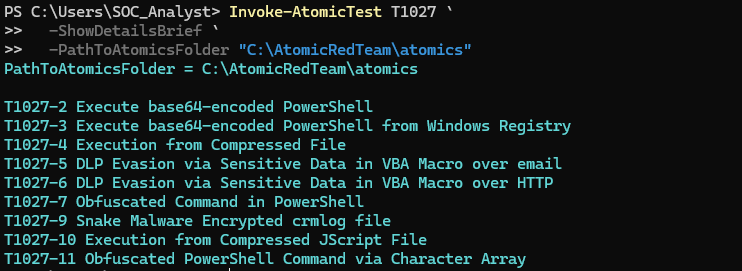
Available Atomic Red Team tests for the T1027 technique.
The selected test was T1027-2 — Execute base64-encoded PowerShell.
The relevant test definition described the creation and execution of Base64-encoded PowerShell code and identified the expected output as:
Hey, Atomic!
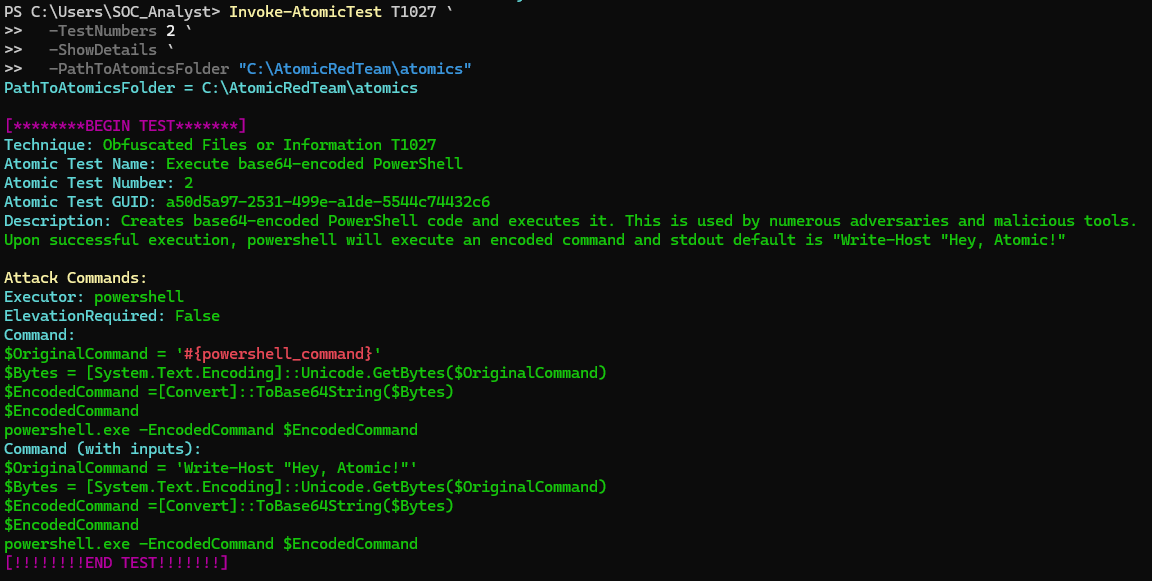
Atomic Red Team T1027-2 definition reviewed before execution.
I then prepared the test using:
Invoke-AtomicTest T1027 `
  -TestNumbers 2 `
  -ShowDetails `
  -PathToAtomicsFolder "C:\AtomicRedTeam\atomics"
Reviewing the test before execution gave me a clear expectation of what I should later find in Windows and Splunk telemetry.
The reviewed Atomic test was subsequently executed.
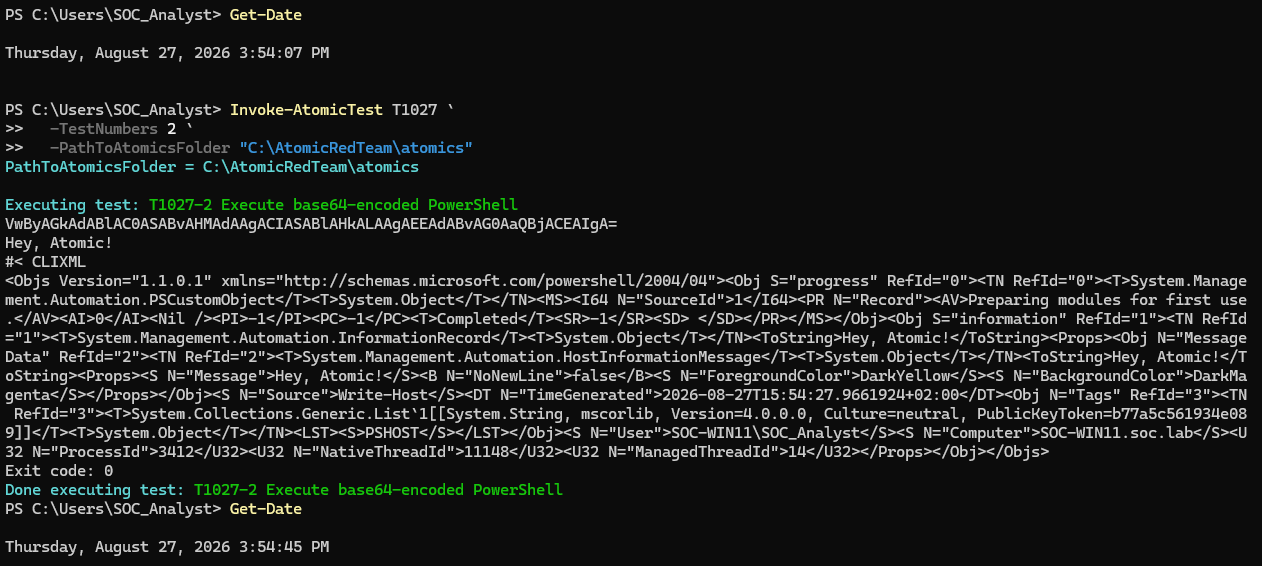
Execution of the reviewed Atomic Red Team test.
At this point, the validation question was straightforward:
Does the existing detection identify the same general behavior that I had previously tested manually?
I evaluated the two existing detections independently.
The first detection searched Sysmon Event ID 1 for PowerShell processes using potentially suspicious execution parameters:
index=* EventCode=1 Image="*powershell.exe"
(CommandLine="*-EncodedCommand*"
OR CommandLine="*-WindowStyle Hidden*")
| stats count by host User CommandLine ParentImage
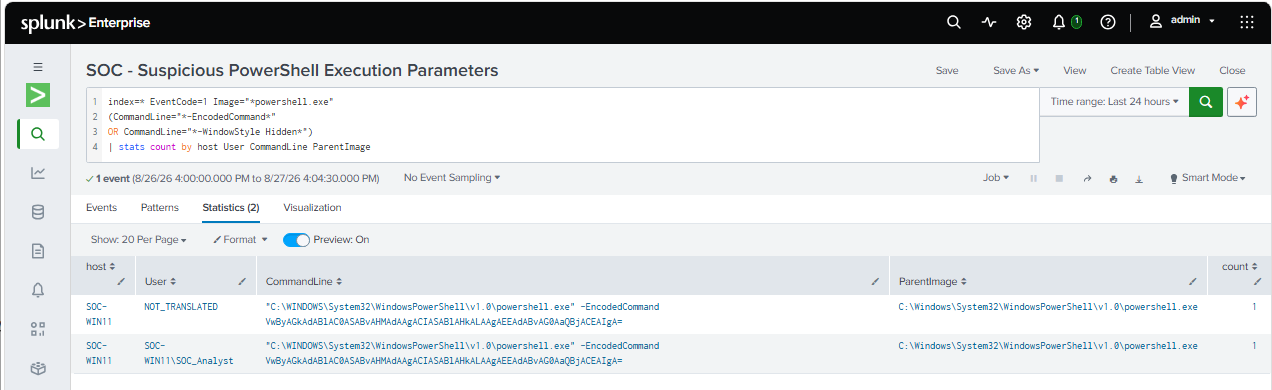
Detection 1 identified PowerShell process creation containing a suspicious execution parameter.
The search returned two records with the same command line but different user fields.
Rather than immediately assuming that two records represented two separate executions, I inspected the underlying Sysmon events:
index=* EventCode=1 Image="*powershell.exe"
CommandLine="*-EncodedCommand*"
| table _time host User Image CommandLine ParentImage ParentCommandLine ProcessId ProcessGuid
| sort _time
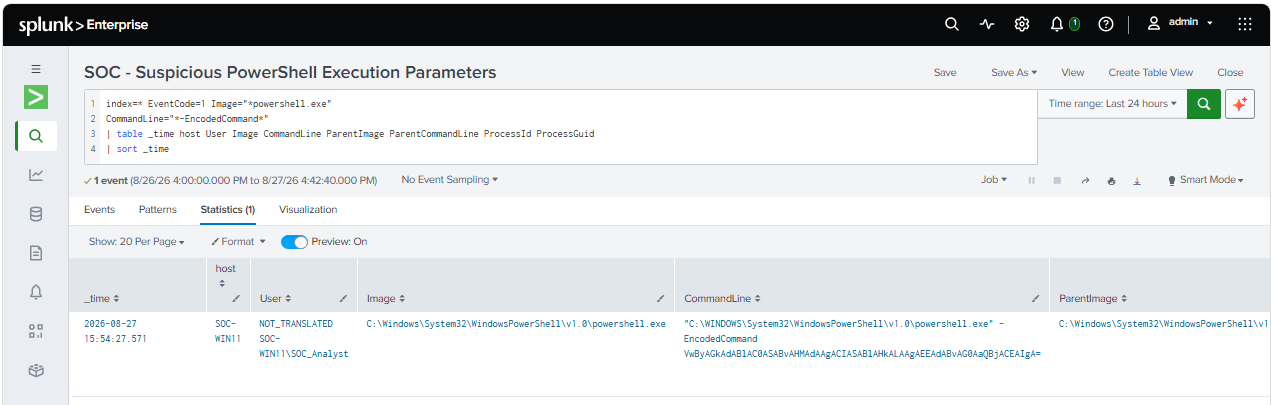
Reviewing the underlying Sysmon fields to determine whether the apparent duplicate represented separate process executions.
This additional check was important because a SOC analyst should avoid interpreting duplicate-looking SIEM results as multiple executions without validating the underlying telemetry.
The Atomic test generated a Sysmon Event ID 1 containing the -EncodedCommand parameter, and the existing detection successfully identified the activity.
This provided the first positive validation result:
The manually developed Detection 1 successfully identified the equivalent behavior generated by Atomic Red Team.
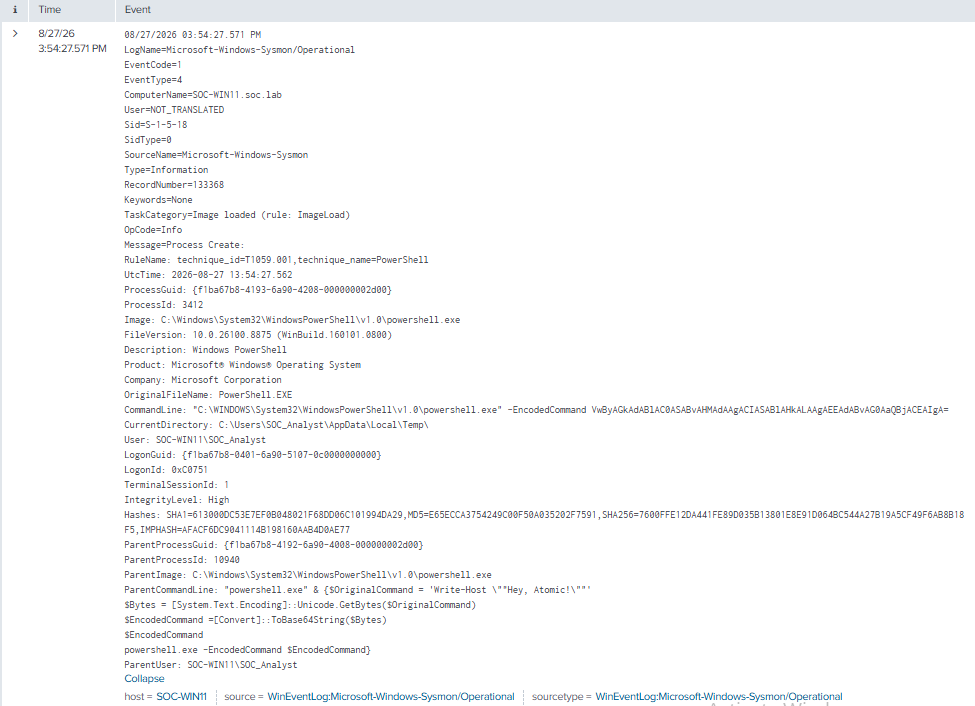
Sysmon Event ID 1 recorded the PowerShell process creation and exposed the -EncodedCommand parameter in the process command line.
I also opened the underlying Windows event to verify that the detection result corresponded to the Atomic execution rather than an unrelated PowerShell process.
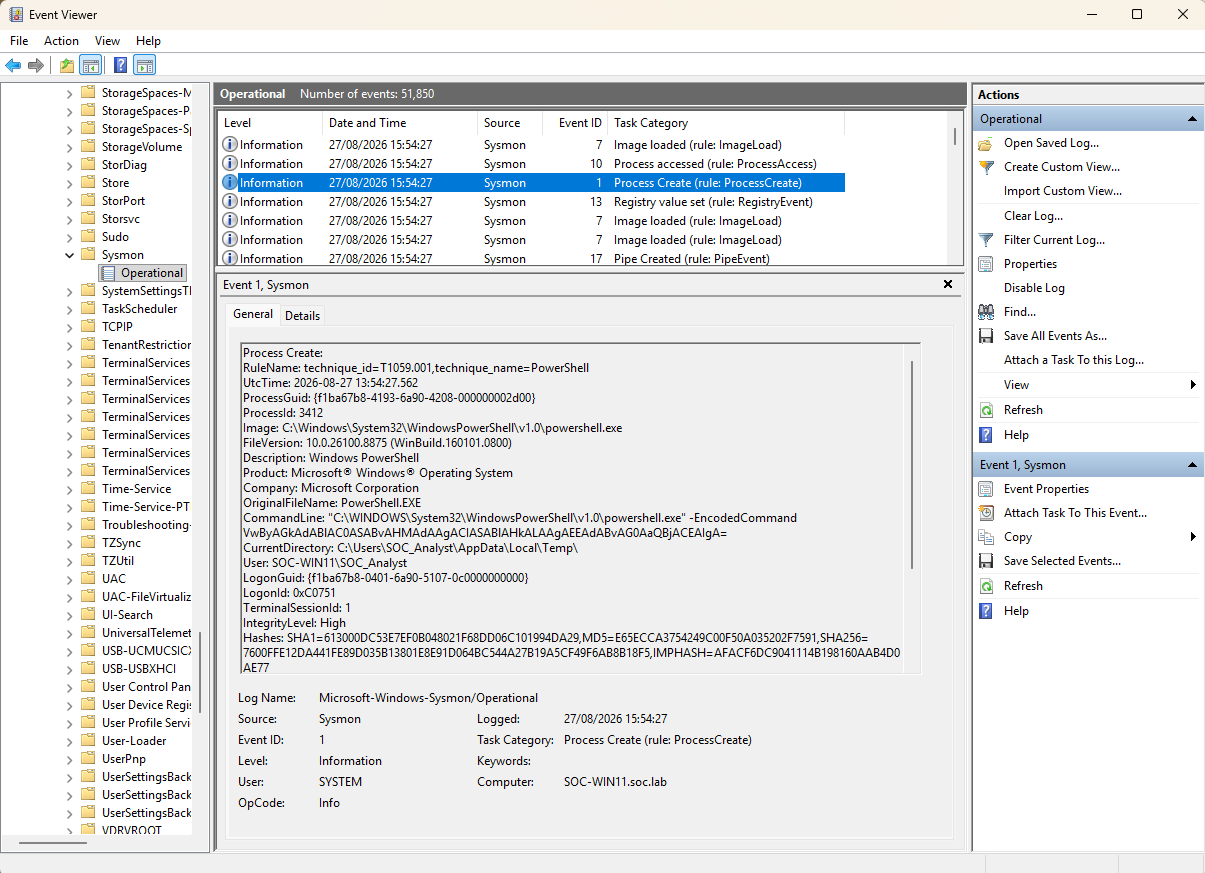
Windows Event Viewer confirmation of the Sysmon process-creation event.
Detection 1 therefore passed the validation.
The second detection used PowerShell Script Block Logging, Event ID 4104.
The original detection searched for several PowerShell commands commonly associated with execution, downloading, or .NET-based network activity:
index=* sourcetype="WinEventLog:Microsoft-Windows-PowerShell/Operational"
EventCode=4104
(
    ScriptBlock="*Invoke-WebRequest*"
    OR ScriptBlock="*Invoke-Expression*"
    OR ScriptBlock="*DownloadString*"
    OR ScriptBlock="*FromBase64String*"
    OR ScriptBlock="*Net.WebClient*"
)
| stats count by host User ScriptBlock
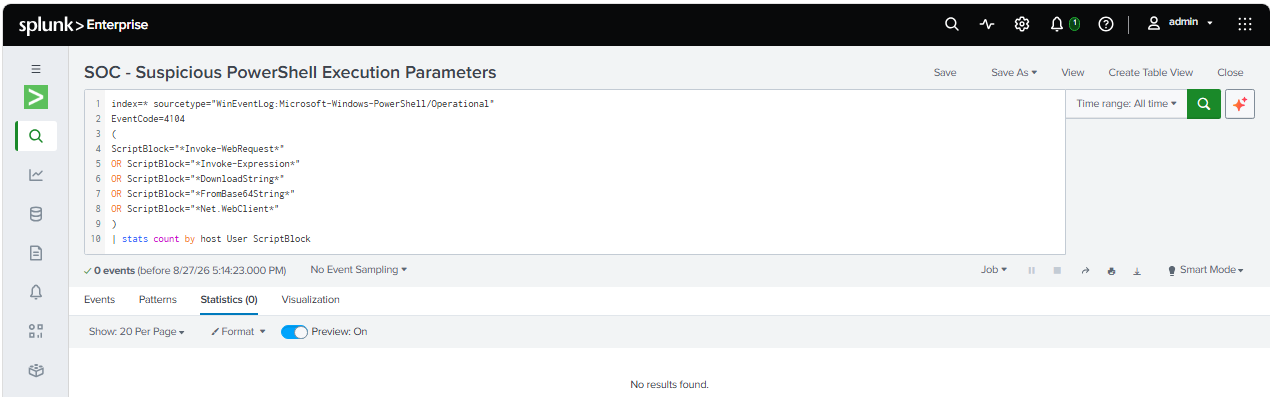
The initial Detection 2 query returned no results for the Atomic Red Team execution.
Unlike Detection 1, this detection failed.
However, a failed detection does not immediately tell us why it failed.
I therefore investigated the generated 4104 events before changing the detection.
The Atomic test had generated PowerShell Event ID 4104, so the next step was to inspect the event directly.
The relevant Script Block content was:
$OriginalCommand = 'Write-Host "Hey, Atomic!"'
$Bytes = [System.Text.Encoding]::Unicode.GetBytes($OriginalCommand)
$EncodedCommand =[Convert]::ToBase64String($Bytes)
$EncodedCommand
powershell.exe -EncodedCommand $EncodedCommand
The original detection searched for:
Invoke-WebRequest
Invoke-Expression
DownloadString
FromBase64String
Net.WebClient
None of those indicators appeared in the Atomic test. Instead, the test generated:
ToBase64String
-EncodedCommand
This immediately explained one part of the detection failure.
The 4104 telemetry was generated correctly, but the original detection criteria were too narrow for the behavior produced by this Atomic test.
However, there was another issue: when I inspected the fields available in Splunk, the ScriptBlock field was empty while the actual Script Block content was contained in the Message field.
I confirmed this by searching directly for the observed indicator:
index=* sourcetype="WinEventLog:Microsoft-Windows-PowerShell/Operational"
EventCode=4104
"-EncodedCommand"
| table _time host User ScriptBlock Message
The result showed the actual Script Block content in Message.
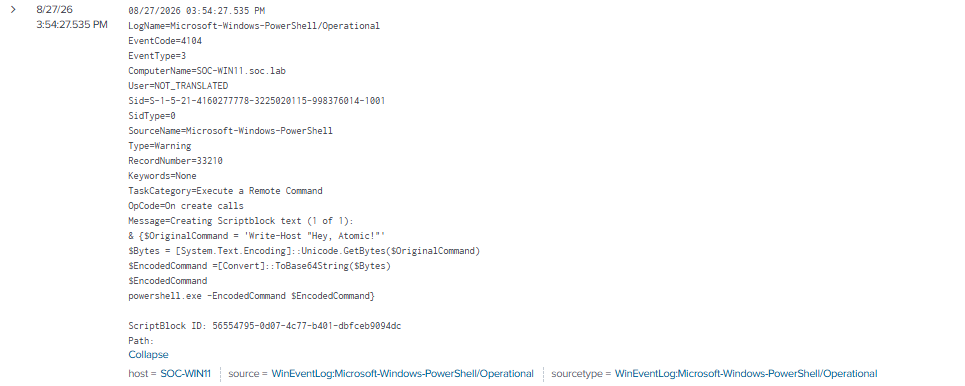
PowerShell Event ID 4104 contained the Atomic execution in the Message field, while the ScriptBlock field was not populated in this Splunk environment.
This was an important distinction: the problem was not that PowerShell failed to generate Script Block logs, but that Detection 2 was searching a field that did not contain the relevant content in this particular Splunk environment.
I also reviewed the corresponding PowerShell Module Logging event, Event ID 4103.
The event showed the resulting command invocation:
CommandInvocation(Write-Host): "Write-Host"
ParameterBinding(Write-Host): name="Object"; value="Hey, Atomic!"
It also showed the PowerShell host application executing with the -EncodedCommand parameter.
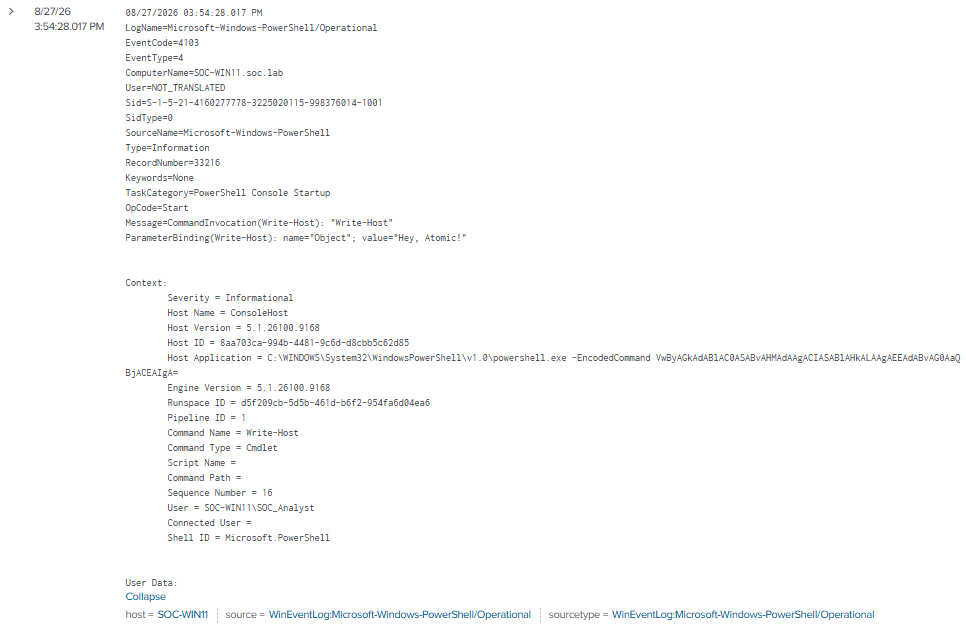
PowerShell Event ID 4103 provided additional evidence of the resulting command execution.
This provided useful corroborating telemetry.
The 4104 event showed the Script Block that constructed and executed the encoded command, while 4103 showed the resulting command invocation. Sysmon Event ID 1 independently showed the PowerShell process creation and command line.
Together, the events provided a consistent view of the same Atomic execution.
For this detection, however, I kept the detection logic focused on 4104 Script Block Logging rather than attempting to build a separate detection around every available telemetry source.
The initial detection therefore required two changes:
-EncodedCommand indicator observed during the Atomic test.The first refined query was:
index=* sourcetype="WinEventLog:Microsoft-Windows-PowerShell/Operational"
EventCode=4104
(
    Message="*Invoke-WebRequest*"
    OR Message="*Invoke-Expression*"
    OR Message="*DownloadString*"
    OR Message="*FromBase64String*"
    OR Message="*Net.WebClient*"
    OR Message="*-EncodedCommand*"
)
| stats count by host User Message
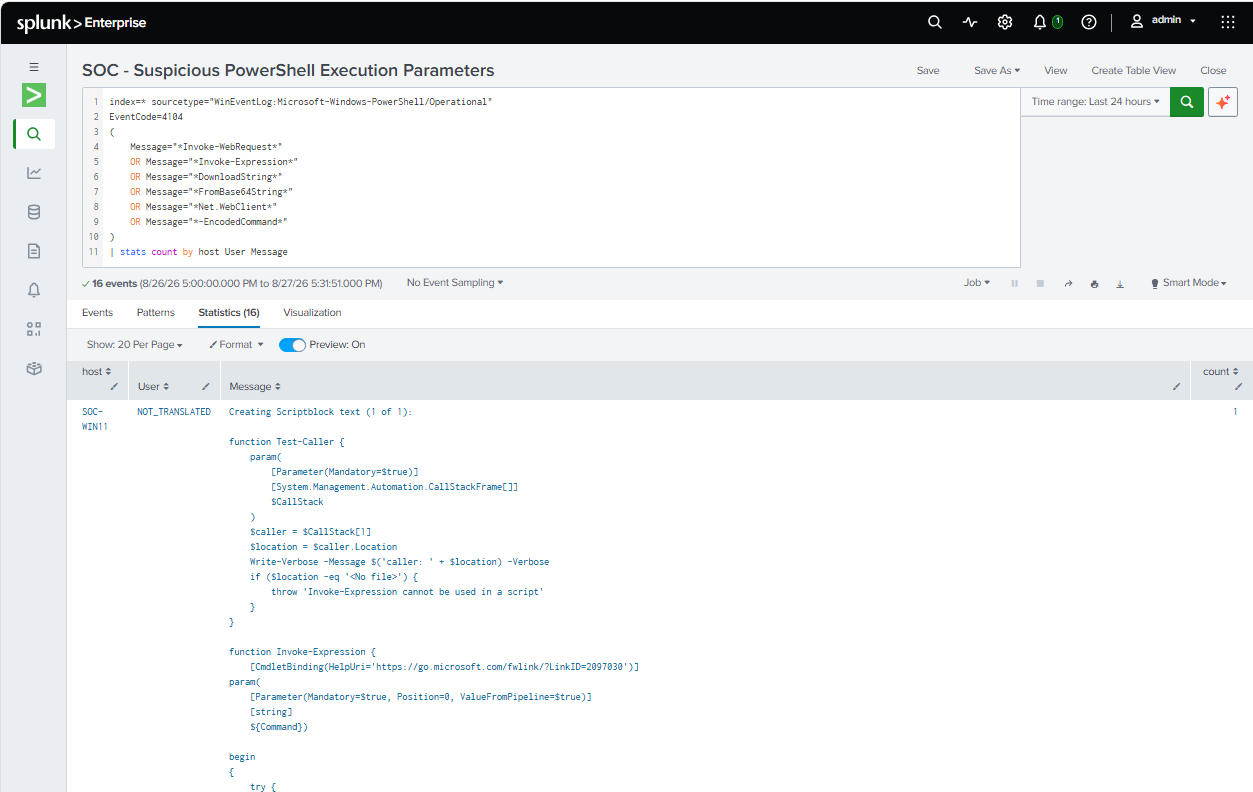
The refined Detection 2 successfully identified the Atomic Red Team execution after correcting the field and expanding the detection criteria.
The detection now successfully identified the activity.
However, the result exposed another practical SOC consideration: the complete 4104 Message field can be very large and difficult to review directly in a detection results table.
The detailed event remains valuable for investigation, but it is not necessarily the best format for initial analyst triage.
Rather than displaying the complete Script Block in the initial search results, I refined the query once more.
The purpose was simple:
Use the detailed event content for detection, but present the analyst with the specific indicator that caused the match.
The final query was:
index=* sourcetype="WinEventLog:Microsoft-Windows-PowerShell/Operational"
EventCode=4104
(
    Message="*Invoke-WebRequest*"
    OR Message="*Invoke-Expression*"
    OR Message="*DownloadString*"
    OR Message="*FromBase64String*"
    OR Message="*Net.WebClient*"
    OR Message="*-EncodedCommand*"
)
| eval Indicator=case(
    like(Message,"%Invoke-WebRequest%"), "Invoke-WebRequest",
    like(Message,"%Invoke-Expression%"), "Invoke-Expression",
    like(Message,"%DownloadString%"), "DownloadString",
    like(Message,"%FromBase64String%"), "FromBase64String",
    like(Message,"%Net.WebClient%"), "Net.WebClient",
    like(Message,"%-EncodedCommand%"), "-EncodedCommand"
)
| table _time host User Indicator
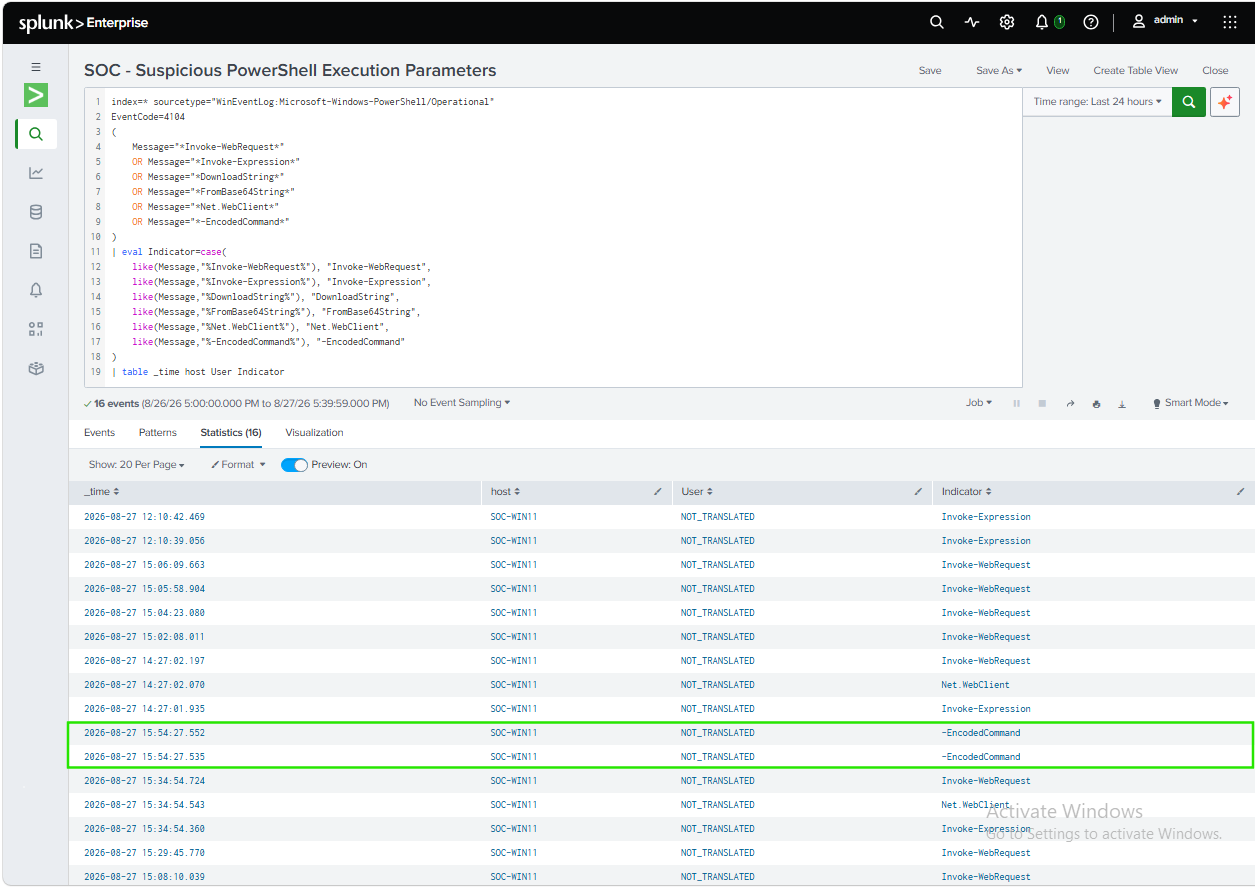
Final Detection 2 output. The query searches the detailed 4104 event but presents a concise indicator for initial analyst triage.
The resulting output was considerably easier to work with:
_time                  host        User             Indicator
2026-08-27 12:10:42    SOC-WIN11   NOT_TRANSLATED   Invoke-Expression
The analyst can immediately see:
If further investigation is required, the underlying 4104 event remains available.
This creates a useful balance between detection coverage and analyst usability.
The two detections produced different results against the same Atomic Red Team execution.
| Detection | Telemetry | Result | Finding |
|---|---|---|---|
| Detection 1 | Sysmon Event ID 1 | PASS | Existing command-line detection identified -EncodedCommand |
| Detection 2 | PowerShell Event ID 4104 | FAIL → PASS | Initial query missed the behavior; field targeting and detection criteria were refined |
This distinction is important.
A detection test should not simply answer:
“Did my SPL return an event?”
It should help determine where the detection chain succeeded or failed.
In this case:
Atomic behavior
      ↓
Endpoint telemetry generated
      ↓
Telemetry ingested by Splunk
      ↓
Detection 1 → PASS
Detection 2 → FAIL
      ↓
Investigate 4104
      ↓
Identify field mismatch + missing indicator
      ↓
Refine detection
      ↓
Detection 2 → PASS
The failed detection was therefore useful. It exposed a weakness that would otherwise have remained hidden.
This detection is indicator-based and should not be treated as proof of malicious activity.
Legitimate PowerShell scripts can use some of the same commands and parameters, including -EncodedCommand and web-request functionality. A detection match should therefore be treated as an investigation lead rather than confirmation of malicious activity.
The effectiveness of the query also depends on the available PowerShell logging and Splunk field extraction.
In this environment, the relevant 4104 Script Block content was available through the Message field rather than the ScriptBlock field. Other environments may use different field mappings or normalized data models.
Finally, the observed user field was displayed as NOT_TRANSLATED. This did not prevent the detection from functioning, but additional identity enrichment would improve the usefulness of the resulting alert in a production SOC.
A failed detection does not necessarily mean that the endpoint failed to generate telemetry. In this case, Event ID 4104 was present and contained the expected activity. The problem was found by examining the actual event rather than immediately rewriting the detection.
The Atomic test revealed -EncodedCommand, which was not included in the original Detection 2 criteria.
Repeatable testing therefore helped identify a genuine coverage gap.
The initial query searched the ScriptBlock field, but in this Splunk environment the relevant content was available in Message.
A detection can therefore fail even when the required telemetry is present if the query is built around the wrong field.
Returning the entire 4104 Script Block made the result difficult to review.
The final query retained the detailed event for investigation while presenting a concise Indicator field in the initial results.
This is a practical approach for L1/L2 analysts: identify the reason for the alert first, then investigate the underlying event when necessary.
Manual testing was useful for establishing the initial baseline, but Atomic Red Team provided a more consistent way to reproduce ATT&CK-mapped behavior. This makes it easier to validate whether detections actually cover the techniques they are intended to identify.
The most useful result of this exercise was not simply that Detection 2 was modified to detect -EncodedCommand.
The more important lesson was the validation process itself.
A detection can fail because:
Atomic Red Team made it possible to separate these possibilities and investigate them systematically.
The final workflow was therefore:
Manual validation
      ↓
Identify detection objective
      ↓
Create repeatable ATT&CK-mapped test
      ↓
Execute Atomic Red Team
      ↓
Verify endpoint telemetry
      ↓
Validate existing detection
      ↓
Investigate detection failures
      ↓
Refine field/indicator selection
      ↓
Improve analyst-facing output
      ↓
Validate again
For a SOC analyst, this is the key takeaway:
A detection is not finished when the SPL query looks correct. It should be validated against observable endpoint behavior, investigated when it fails, and refined until the resulting alert provides useful information for the analyst who has to respond to it.
A detection-engineering exercise using Sigma, Splunk, Windows telemetry, and Atomic Red Team to validate vendor-neutral detection logic
Designing an Operational Monitoring Dashboard for Authentication, Endpoint, Network, and Threat Hunting Visibility
Correlating failed logons, Kerberos authentication events, SMB access, and blocked lateral movement attempts in a hardened Active Directory environment