From Splunk to Sigma: Building and Validating Vendor-Neutral Detection Logic
A detection-engineering exercise using Sigma, Splunk, Windows telemetry, and Atomic Red Team to validate vendor-neutral detection logic


Authentication and lateral movement activity are among the most common signals investigated in Security Operations Centers (SOC). While isolated authentication failures or administrative share access may appear benign, correlating authentication sequences with Kerberos activity, SMB access, and endpoint execution attempts can reveal credential misuse and early-stage lateral movement behavior.
In this investigation, a realistic Active Directory authentication workflow was simulated, including repeated authentication attempts followed by lateral movement techniques. Several remote execution methods were intentionally blocked due to defensive controls in the lab environment.
The objective of this exercise is not only to simulate attacker behavior, but to demonstrate how SOC analysts can reconstruct intent using telemetry even when execution is prevented.
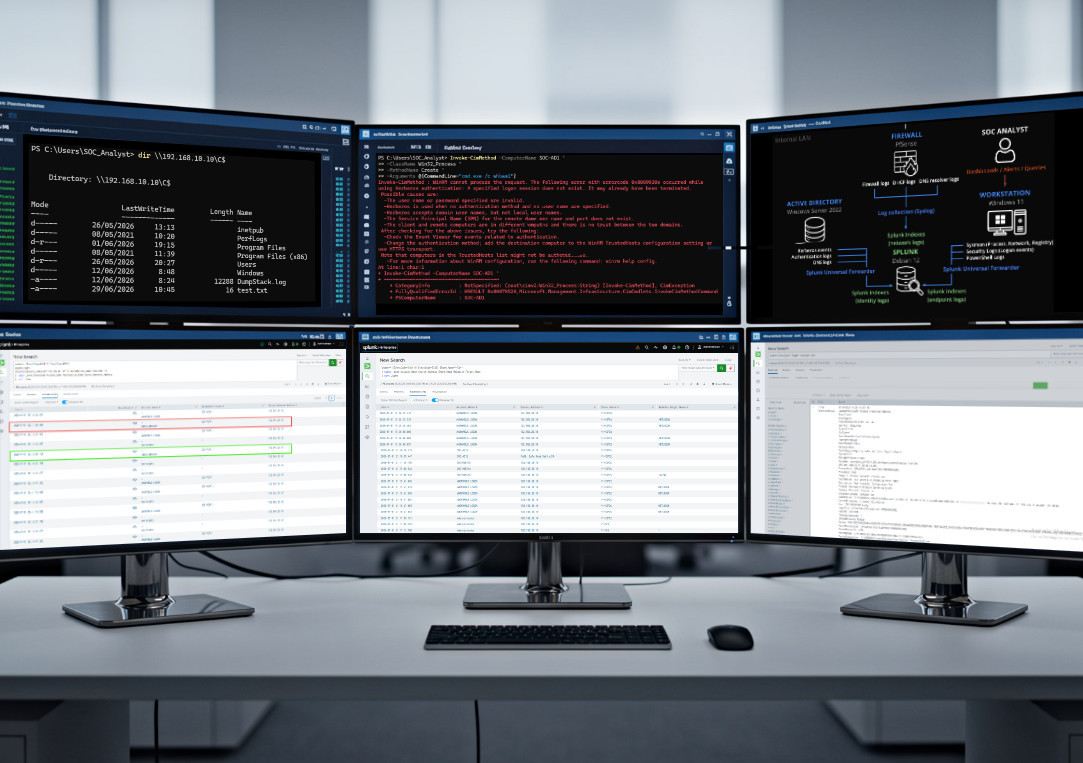
| Component | Role |
|---|---|
| Windows 11 Workstation | User endpoint |
| Active Directory Domain Controller | Identity & authentication |
| Sysmon | Process and network telemetry |
| PowerShell Logging | Script visibility |
| Splunk | Central log correlation |
| pfSense | Network segmentation and firewall logs |
A sequence of authentication attempts was performed against an administrative account.
Failed authentication attempt
net use \\192.168.10.10\C$ /user:soclab\administrator WrongPassword
Successful authentication attempt
net use \\192.168.10.10\C$ /user:soclab\administrator CorrectPassword


Failed logons followed by successful authentication using a privileged account. This sequence is commonly observed during credential validation or password guessing activity.
Get-ChildItem \\192.168.10.10\C$
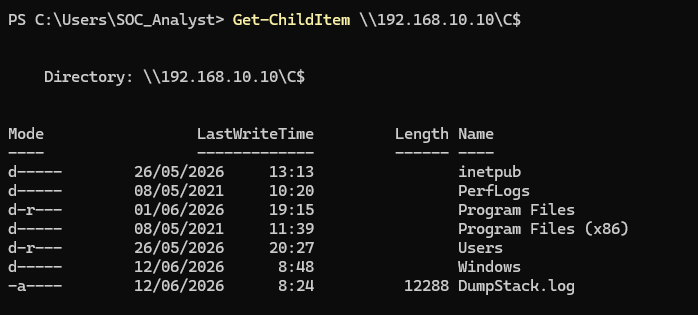
Kerberos authentication confirms the authenticated user can access domain resources.
dir \\192.168.10.10\C$

Copy-Item .\test.txt "\\192.168.10.10\C$\" -Verbose
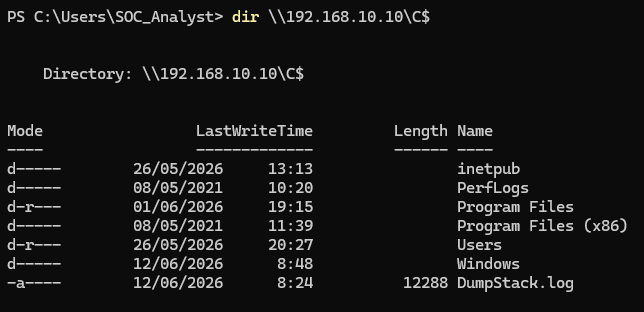

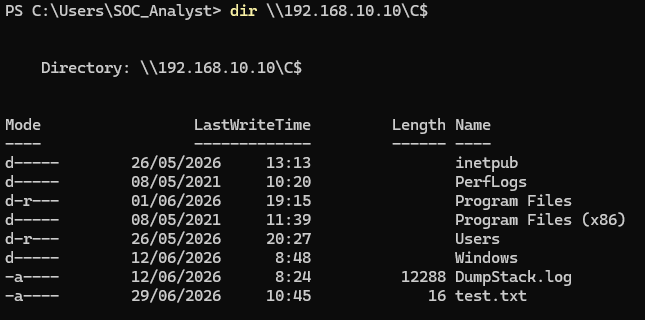 Access and file transfer via administrative SMB share (C$), commonly used in both legitimate administration and lateral movement.
Multiple lateral movement techniques were attempted against the Domain Controller:
Enter-PSSession -ComputerName SOC-AD1 -Credential soclab\administrator
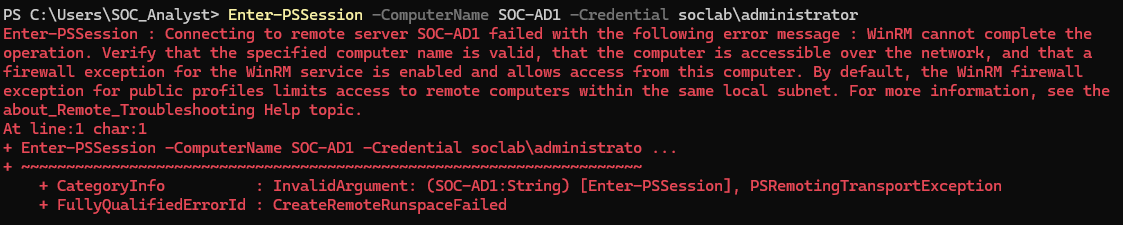
Result: PowerShell Remoting attempt blocked due to endpoint or firewall restrictions.
Invoke-CimMethod -ComputerName SOC-AD1 `
-ClassName Win32_Process `
-MethodName Create `
-Arguments @{CommandLine="cmd.exe /c whoami"}
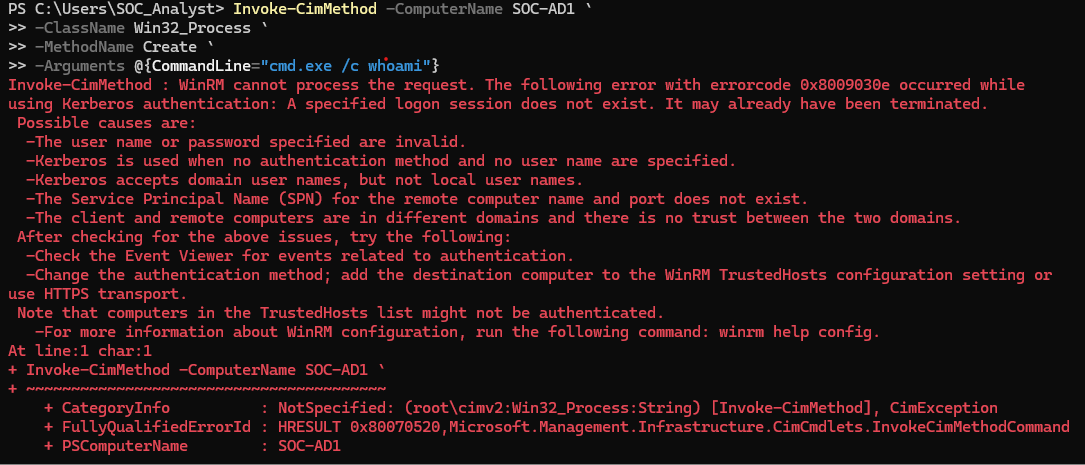
Result: WMI remote execution attempt was unsuccessful due to the lab’s security configuration.
schtasks /create /s 192.168.10.10 /u soclab\administrator /p DCPassword /sc once /tn "TestTask" /tr "cmd.exe /c whoami" /st 00:00

schtasks /run /s 192.168.10.10 /tn "TestTask"

Result: Remote scheduled task creation blocked, preventing traditional lateral movement via task scheduler.
At this stage, I shifted from activity simulation to log analysis and validation.
index=* EventCode=4625
| table _time Account_Name Workstation_Name Source_Network_Address Status Failure_Reason
| sort _time
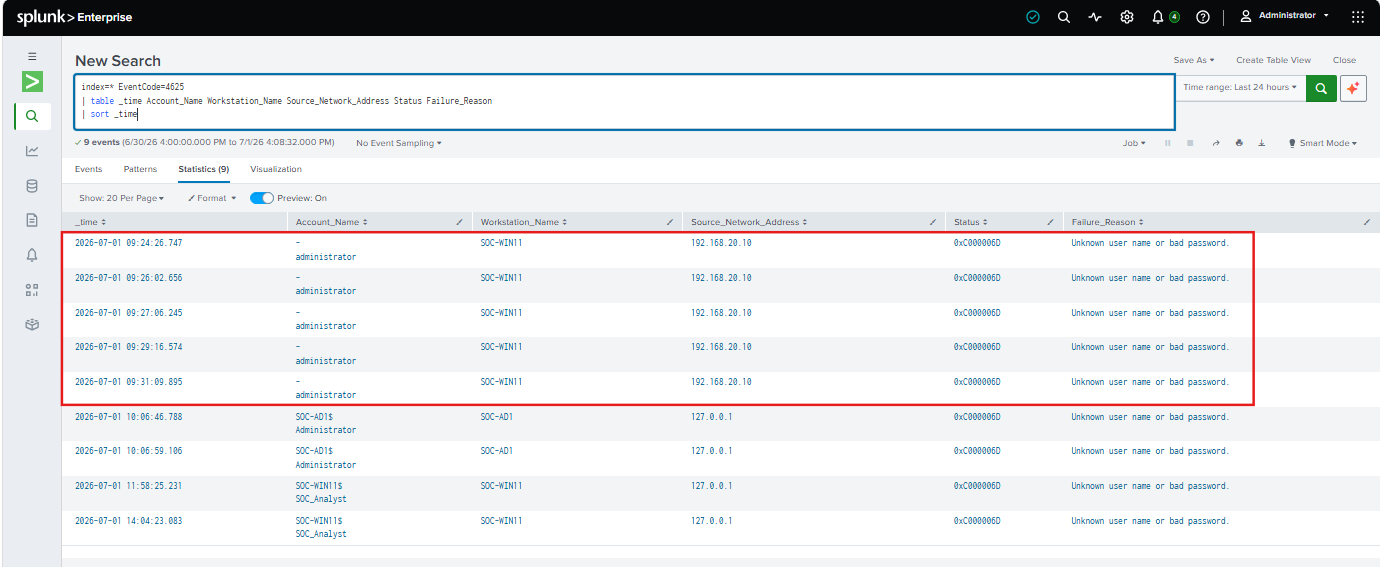
Failed authentication events were reviewed to identify potential brute-force or credential validation attempts against privileged accounts. Multiple failed logons were observed originating from the same source host.
index=* (EventCode=4624 OR EventCode=4625)
Logon_Type=3
(Source_Network_Address="192.168.20.10" OR Workstation_Name="SOC-WIN11")
| table _time EventCode Account_Name Workstation_Name Source_Network_Address
| sort _time
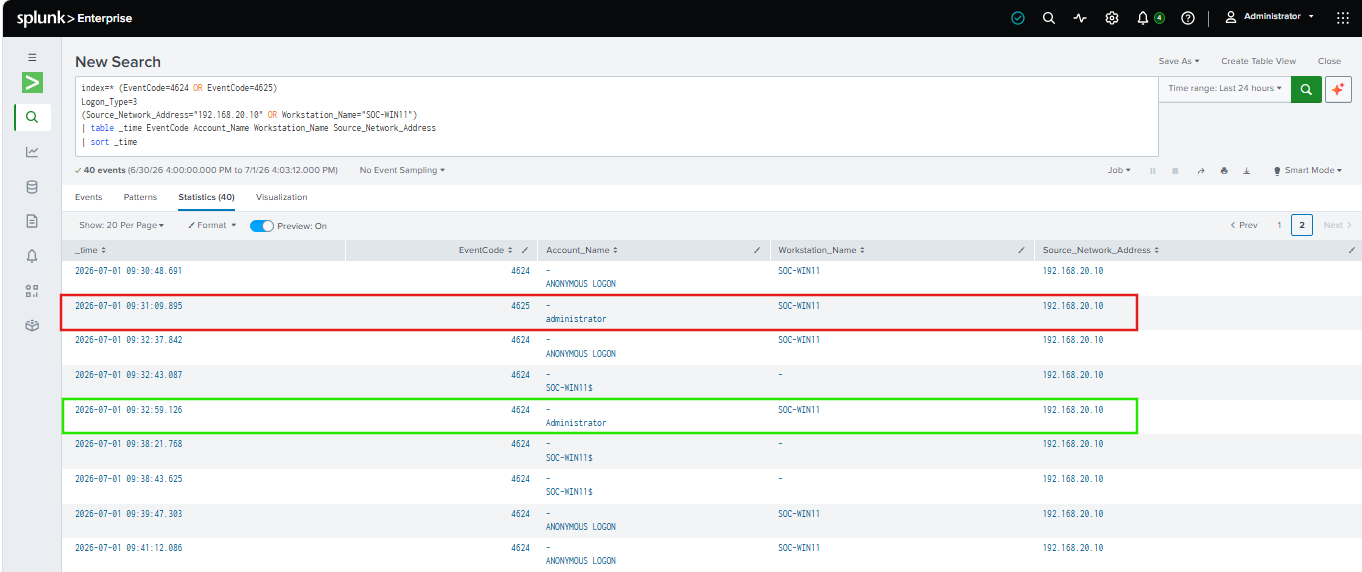
A successful authentication event was observed following repeated failed logons from the same source system, indicating a potential credential validation or password guessing pattern.
index=* (EventCode=4768 OR EventCode=4769)
Account_Name="Administrator*"
Client_Address="::ffff:192.168.20.10"
| table _time EventCode Account_Name Service_Name Client_Address Failure_Code
| sort _time
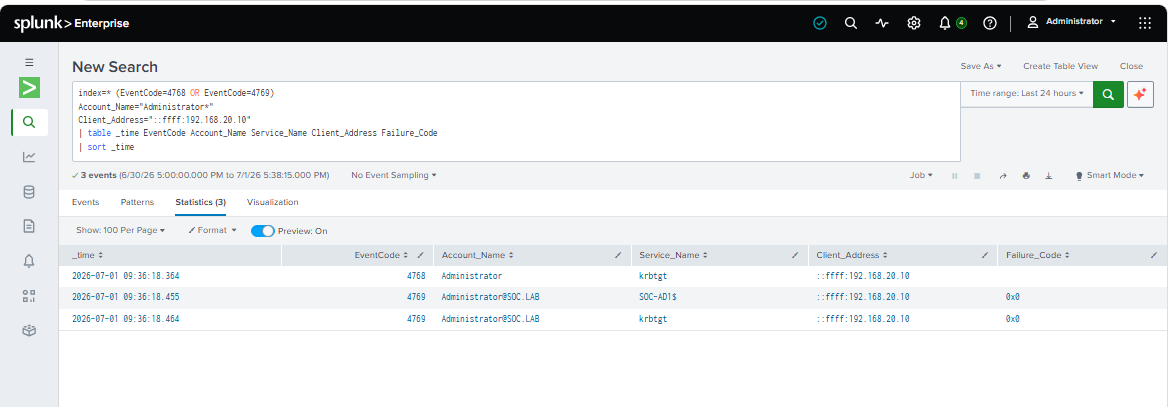
Kerberos ticket activity was reviewed to confirm whether authentication succeeded and whether service access was requested.
index=* (EventCode=5140 OR EventCode=5145) Share_Name="*C$*"
| table _time Account_Name Source_Address Share_Name Relative_Target_Name
| sort _time
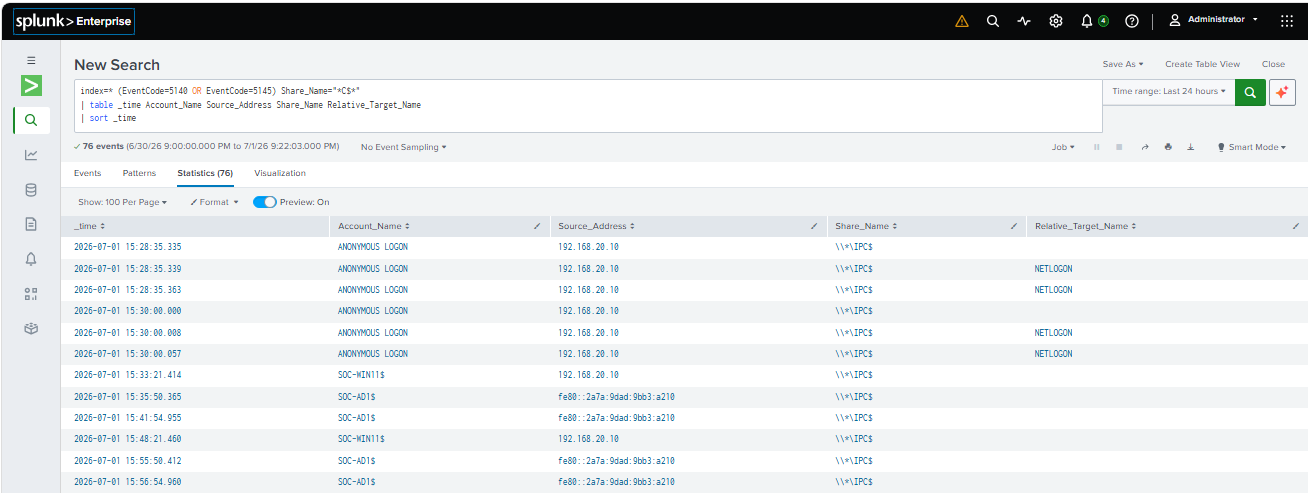
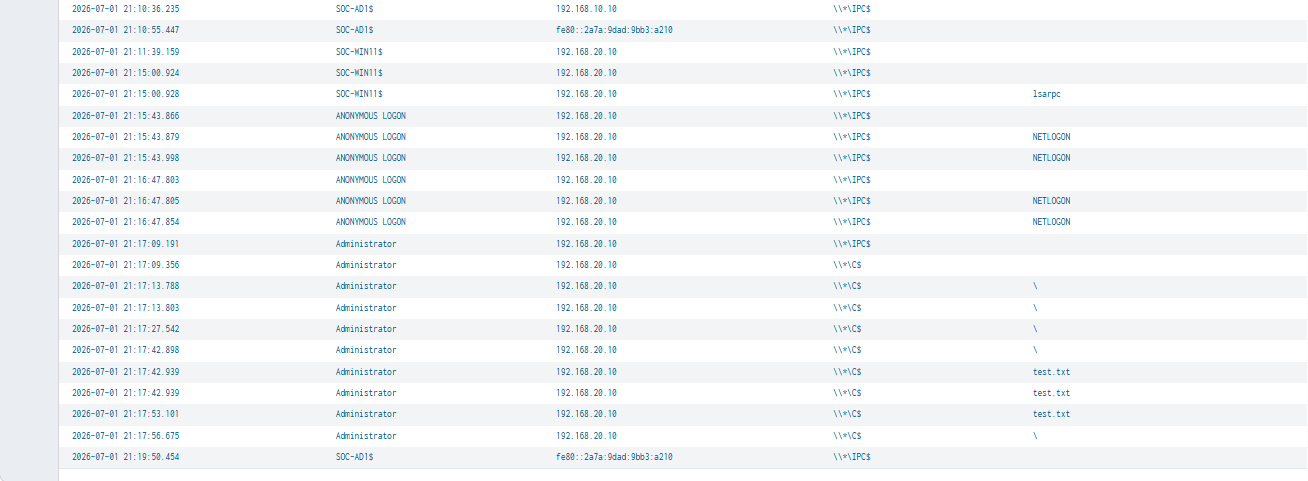
File Share auditing was enabled on the Domain Controller to determine whether administrative SMB access activity was being properly captured in security telemetry.
After enabling the relevant audit policy, the SMB access activity was re-generated by repeating the administrative share interaction to confirm that Event ID 5140/5145 events were being properly logged and ingested into Splunk.
Initial network telemetry indicated potential lateral movement activity involving common remote administration and RPC-related ports:
index=* (DestinationPort=5985 OR DestinationPort=445 OR DestinationPort=135)
| table _time host User DestinationIp DestinationPort Image
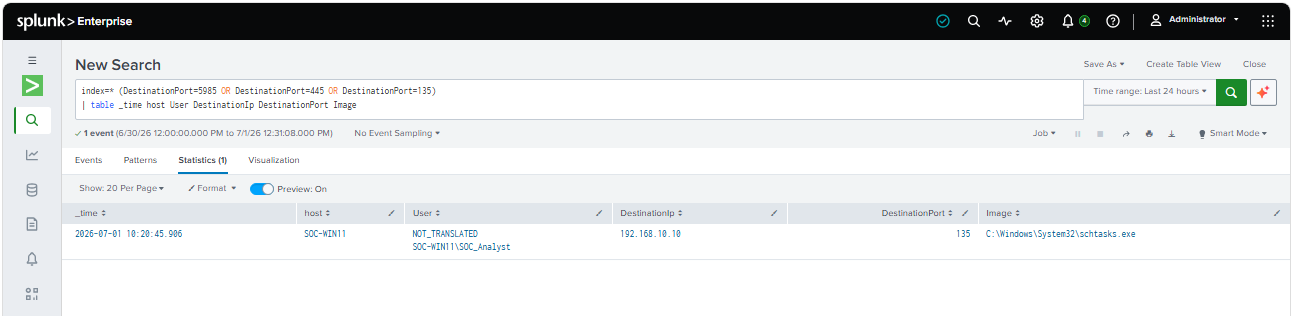
This prompted an investigation into a possible Scheduled Task-based remote execution attempt.
To confirm whether a Scheduled Task operation was initiated from the workstation, process creation telemetry was reviewed:
index=* EventCode=1 Image="*schtasks.exe"
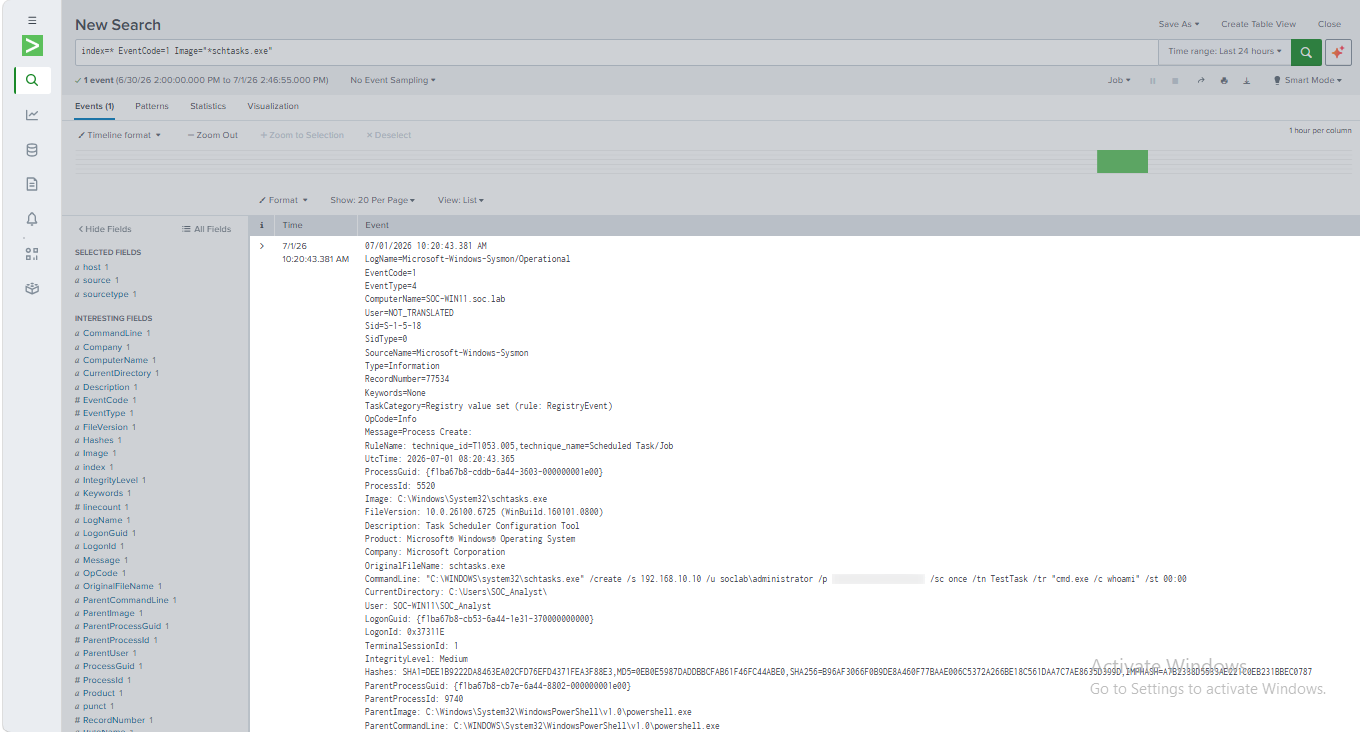
This confirmed execution of schtasks.exe on the source system (SOC-WIN11), indicating that the attack attempt was initiated locally.
Next, scheduled task creation events were searched on the Domain Controller:
index=* EventCode=4698

No scheduled task creation events were observed on the target system.
This indicates that the remote task creation request did not complete successfully.
To further validate whether any partial task creation or modification occurred, additional task-related events were reviewed:
index=* (EventCode=4702 OR EventCode=4699)

No task modification or update events were identified.
To determine whether any indirect execution occurred (e.g., via task scheduler services), process execution traces were reviewed:
index=* EventCode=1
(CommandLine="*whoami*" AND ParentImage IN ("*taskeng.exe*", "*taskhostw.exe*", "*svchost.exe*"))

No execution artifacts consistent with scheduled task execution were identified.
Finally, process execution on the Domain Controller was directly checked:
index=* host=SOC-AD1 EventCode=1 cmd.exe
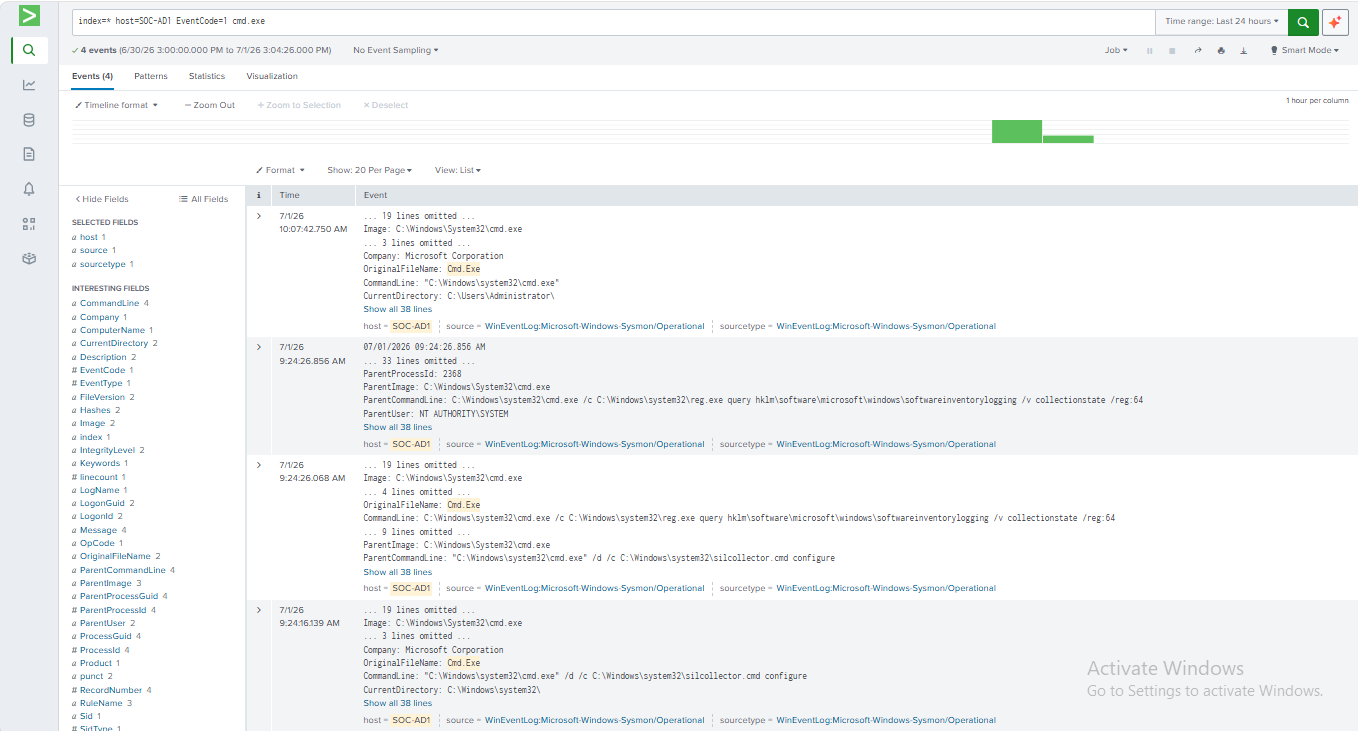
No corresponding process execution was observed on the target system.
The analysis shows:
These findings indicate that the remote Scheduled Task-based lateral movement attempt did not result in execution on the target system, and was effectively blocked by existing security controls.
By correlating authentication, SMB access, and endpoint telemetry, the following sequence was reconstructed:
| Time | Activity |
|---|---|
| 09:24:26 | First failed logon (4625) |
| 09:32:59 | Successful logon (4624) |
| 09:36:18 | Kerberos TGT issued (4768) |
| 09:36:18 | Kerberos Service Ticket issued (4769) |
| - | Lateral movement attempt via WinRM (blocked) |
| - | WMI execution attempt (blocked) |
| 10:20:45 | Scheduled Task execution attempt (blocked) |
| 21:17:21 | Administrative Share Access (5140) (re-generated) |
Unlike a typical lab where remote execution succeeds, this environment demonstrated multiple lateral movement techniques were attempted but blocked by security controls. However, authentication and SMB telemetry still provided full visibility into intent and attack workflow.
This mirrors real enterprise environments where execution is prevented but attacker intent is still observable
This investigation demonstrates that even in hardened Active Directory environments where lateral movement techniques are blocked, SOC analysts can still reconstruct attacker intent through authentication patterns, SMB access, and endpoint telemetry.
Rather than relying on successful exploitation, detection engineering focuses on correlating weak signals across identity, network, and endpoint layers to identify malicious intent.
This lab demonstrates not just tool usage, but security architecture awareness:
A detection-engineering exercise using Sigma, Splunk, Windows telemetry, and Atomic Red Team to validate vendor-neutral detection logic
How to Validate PowerShell Detections in Splunk with Sysmon, Atomic Red Team, and MITRE ATT&CK
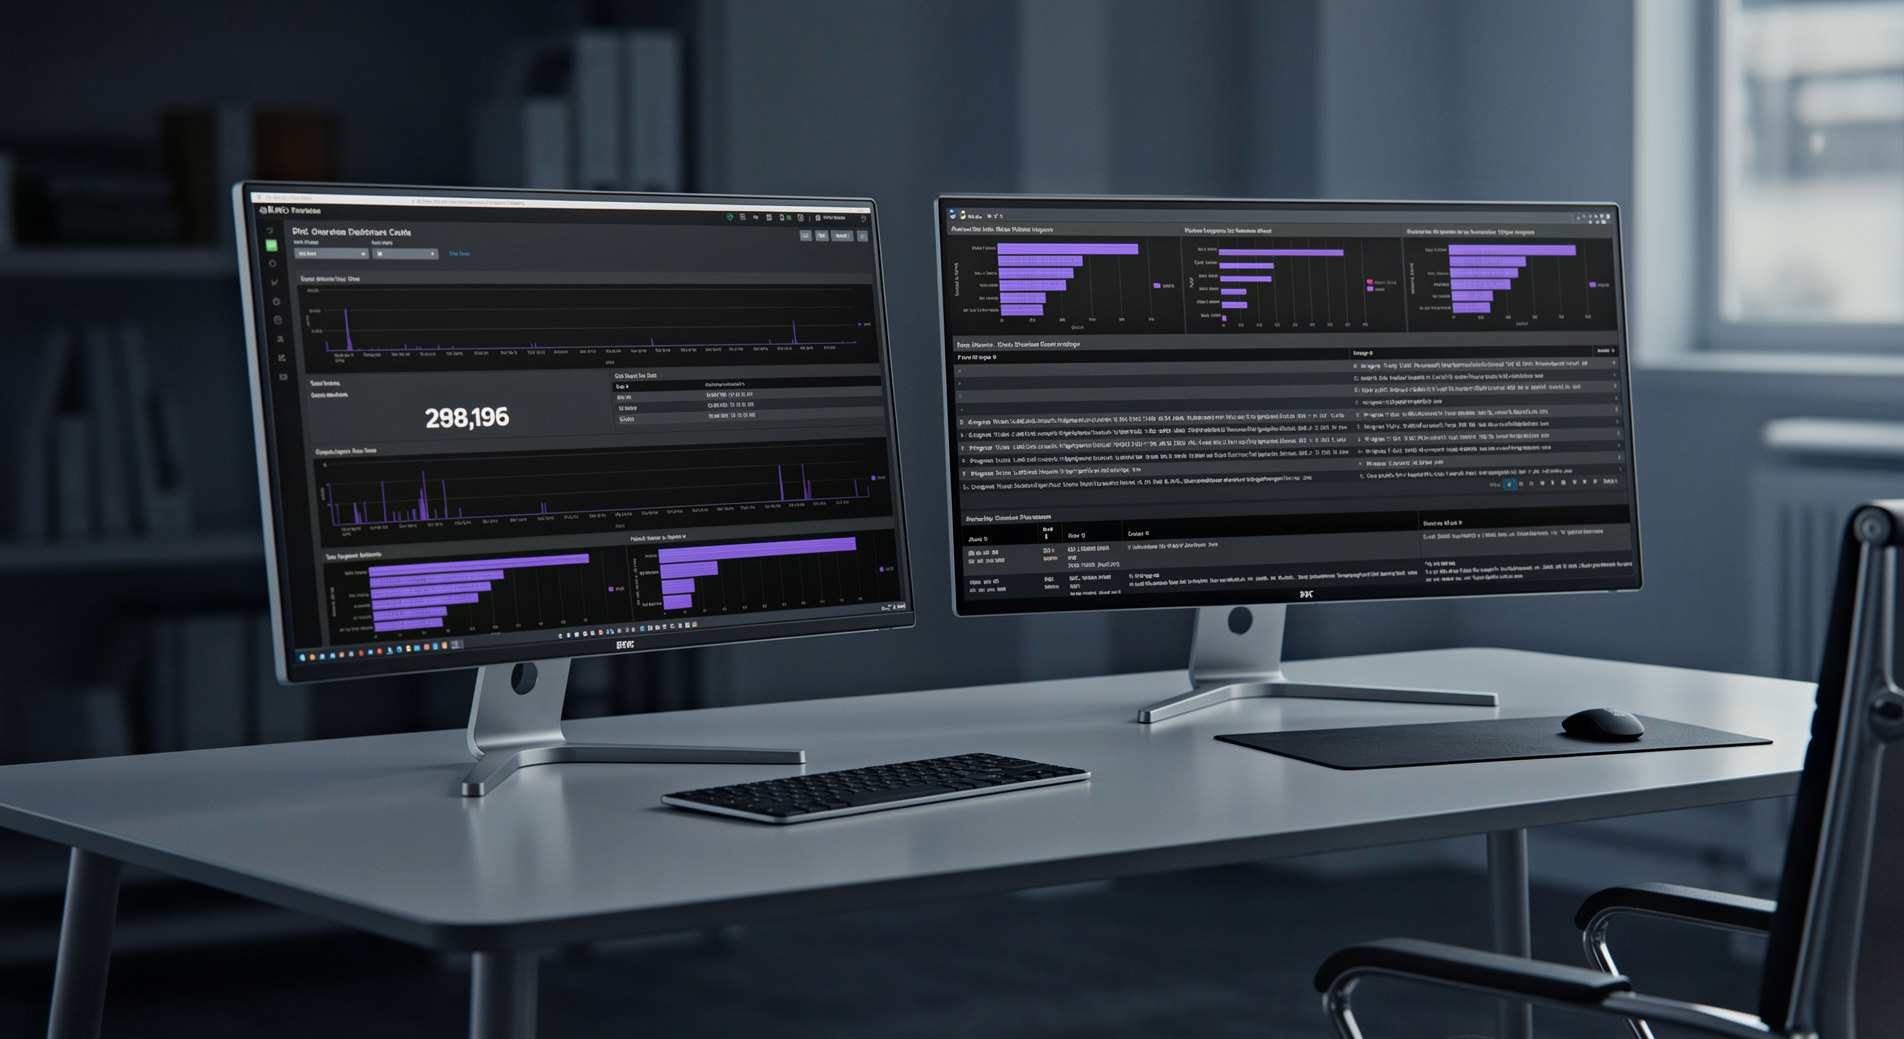
Designing an Operational Monitoring Dashboard for Authentication, Endpoint, Network, and Threat Hunting Visibility