
From Splunk to Sigma: Building and Validating Vendor-Neutral Detection Logic
A detection-engineering exercise using Sigma, Splunk, Windows telemetry, and Atomic Red Team to validate vendor-neutral detection logic


In this lab, I simulated suspicious PowerShell activity on a Windows 11 endpoint and investigated the resulting telemetry using Sysmon, PowerShell logging, and Splunk.
The objective was to identify behaviors commonly associated with attacker activity, analyze the resulting logs, and develop a basic detection rule that could be used by a SOC analyst during an investigation.
| Component | Purpose |
|---|---|
| Windows 11 | Endpoint |
| Sysmon | Process and network telemetry |
| PowerShell Logging | Script visibility |
| Splunk | Log aggregation and analysis |
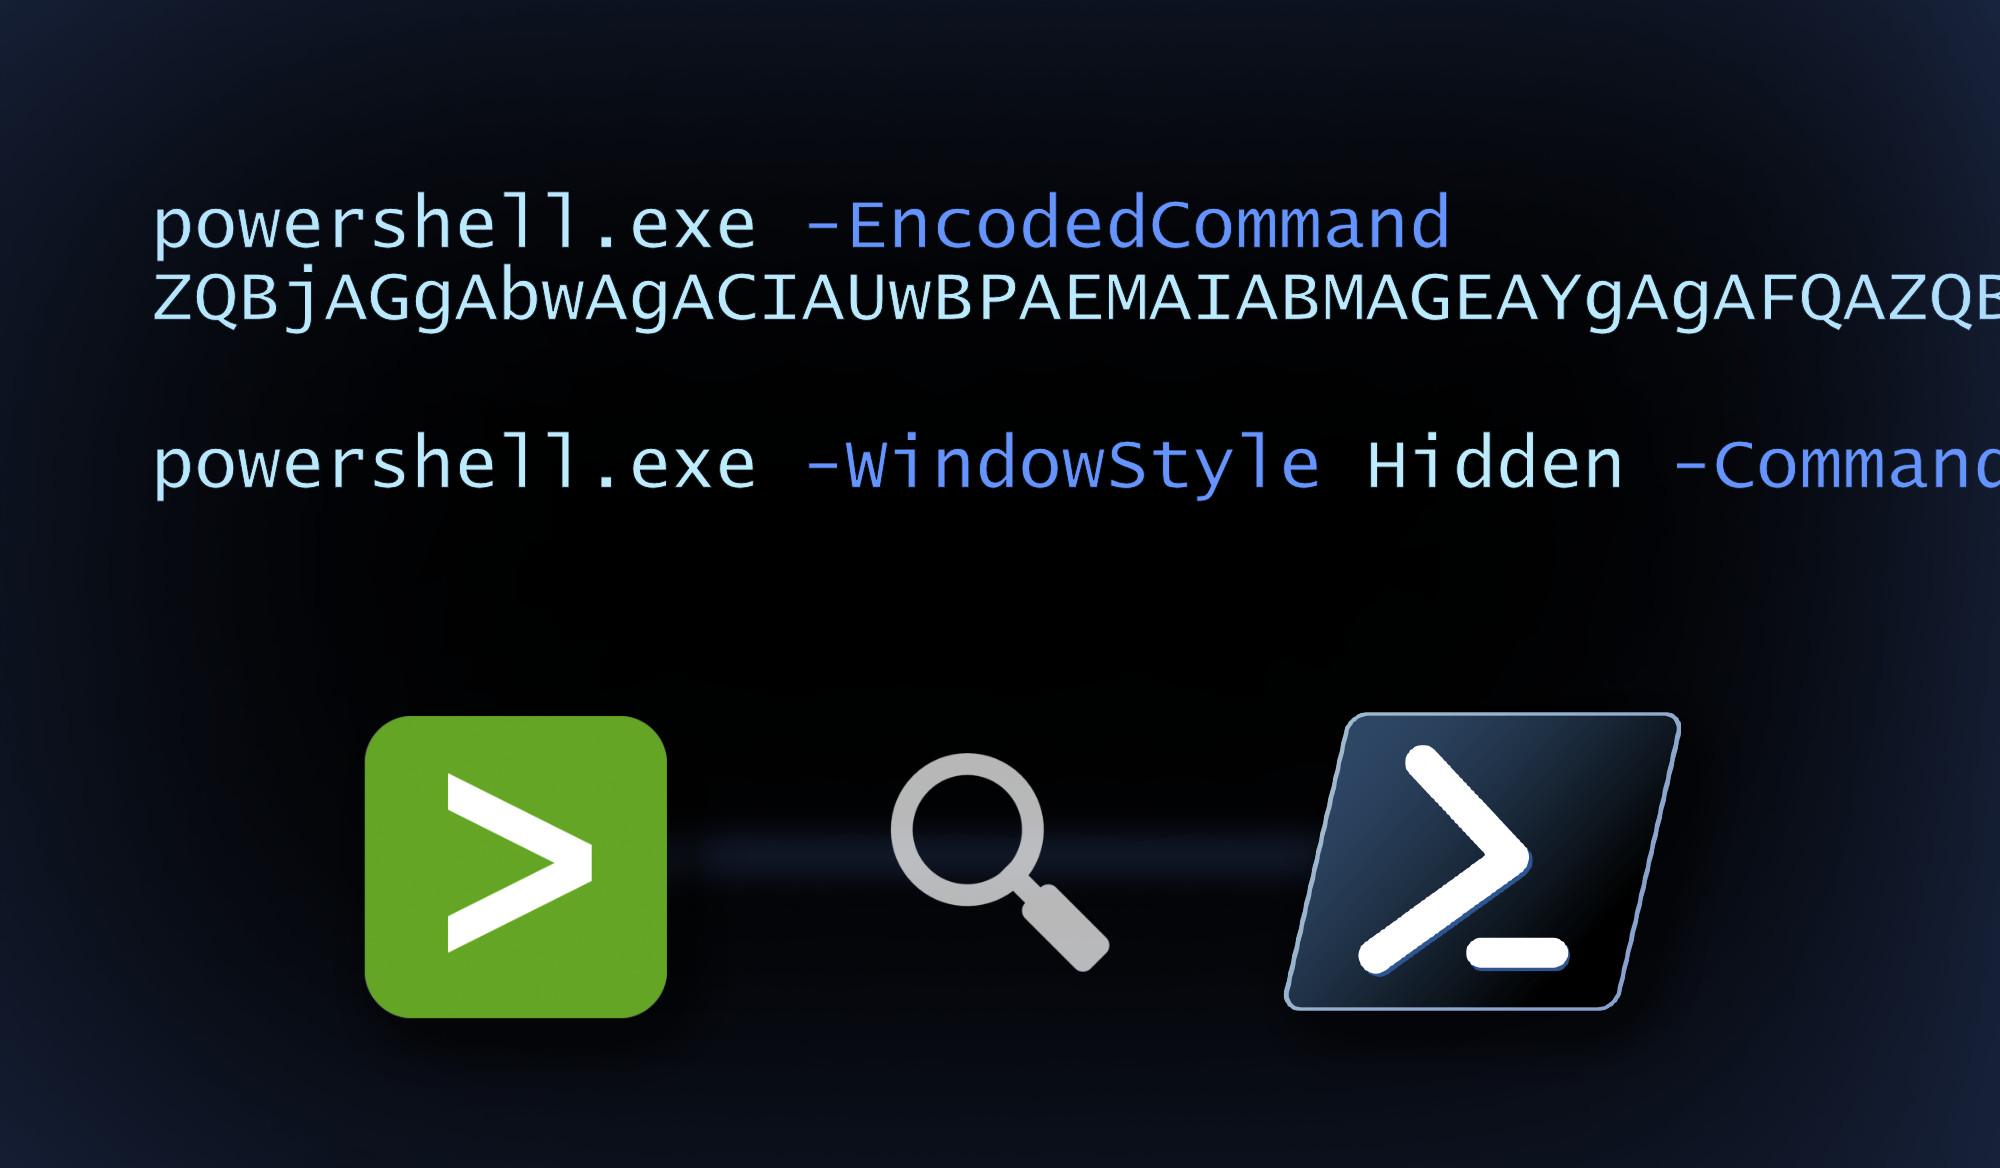
powershell.exe -EncodedCommand ZQBjAGgAbwAgACIAUwBPAEMAIABMAGEAYgAgAFQAZQBzAHQAIgA=

powershell.exe -WindowStyle Hidden -Command "echo 'hidden test'"

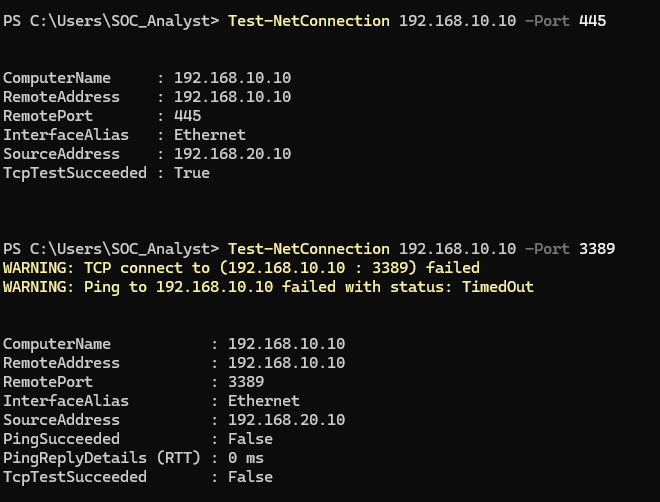
Test-NetConnection 192.168.10.10 -Port 445

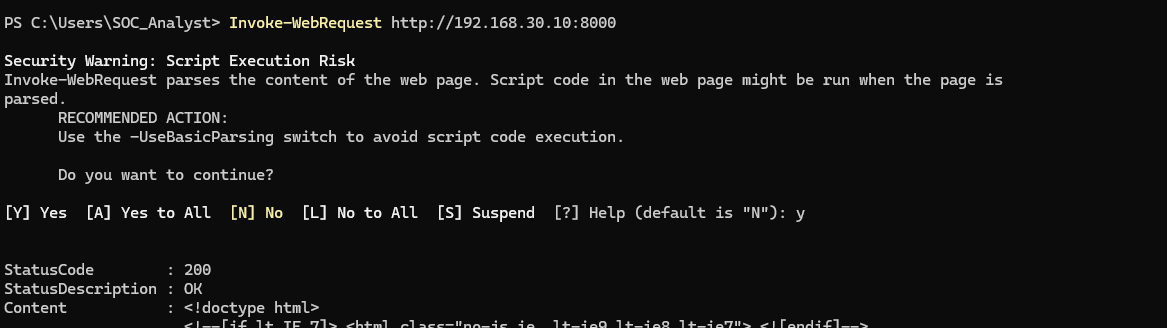
Invoke-WebRequest http://192.168.30.10:8000

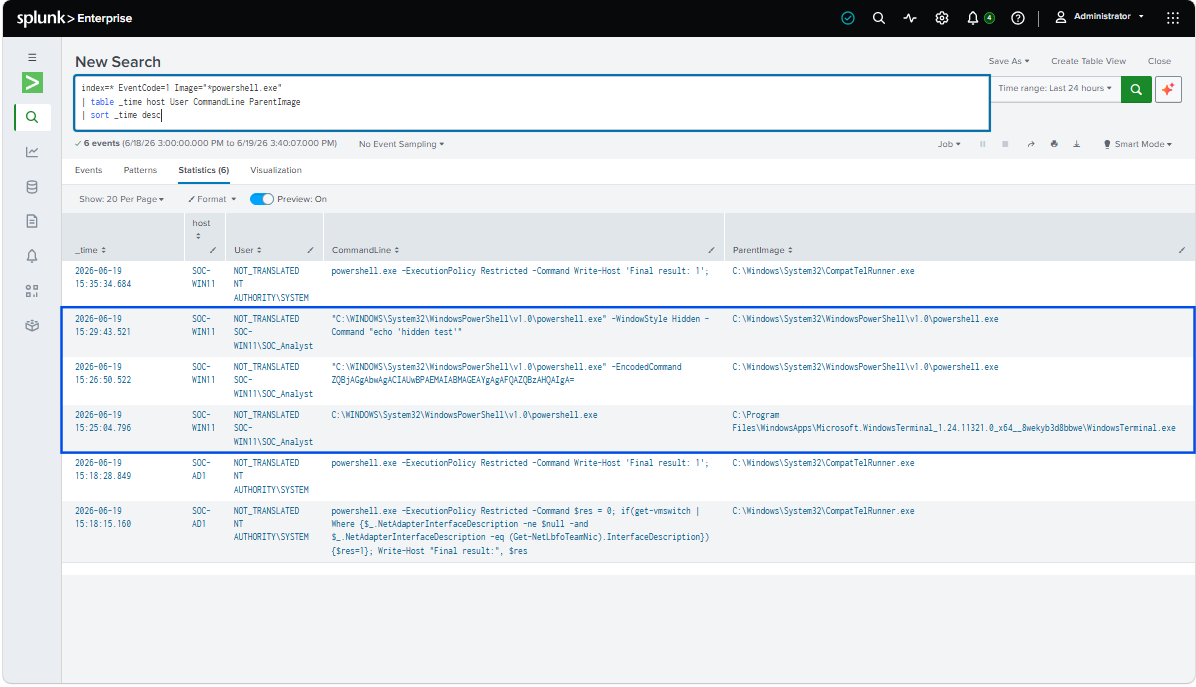
Using Sysmon Event ID 1 (Process Creation), I searched for PowerShell executions on the endpoint.
index=* EventCode=1 Image="*powershell.exe"
| table _time host User CommandLine ParentImage
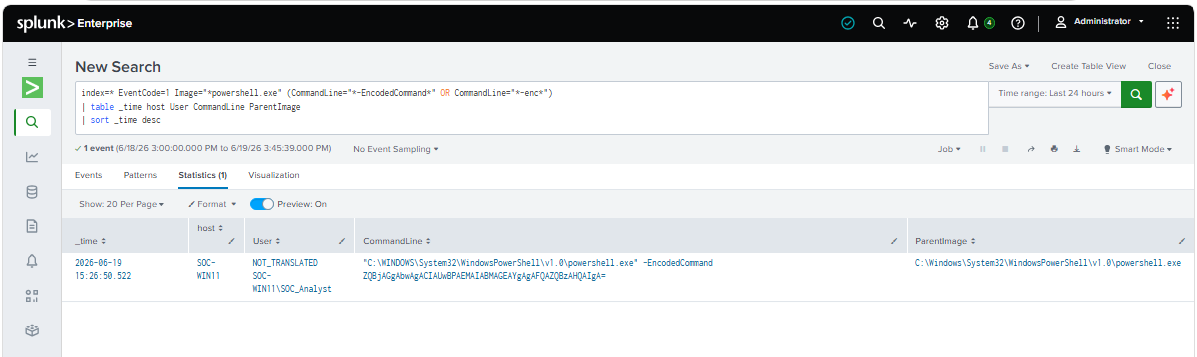
Encoded PowerShell commands are commonly used to obscure command content and evade simple detections.
index=* EventCode=1 Image="*powershell.exe"
(CommandLine="*-EncodedCommand*" OR CommandLine="*-enc*")
| table _time host User CommandLine ParentImage
Attackers frequently use hidden PowerShell windows to reduce user visibility and avoid drawing attention to their activity.
index=* EventCode=1 Image="*powershell.exe"
(CommandLine="*-WindowStyle Hidden*" OR CommandLine="*-w hidden*")
| table _time host User CommandLine ParentImage
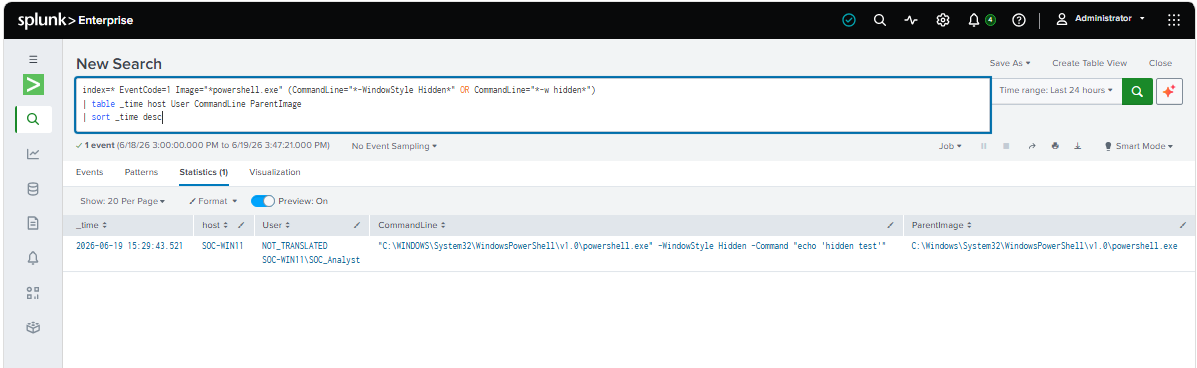
Sysmon Event ID 1 provides visibility into how PowerShell was launched, including its command-line arguments. However, it does not always reveal the actual PowerShell code that was executed. To inspect the executed code itself, I turned to PowerShell Script Block Logging (Event ID 4104) in the Microsoft-Windows-PowerShell/Operational log.
Using the following search, I reviewed the PowerShell Operational events:
index=* sourcetype="WinEventLog:Microsoft-Windows-PowerShell/Operational" EventCode=4104
| table _time host User ScriptBlock Path
The initial encoded PowerShell command executed only a very small script, making it difficult to demonstrate the value of Script Block Logging. To generate richer telemetry, I created a larger PowerShell payload containing several commands and encoded it as Base64.
$script = @'
$lab = "SOC Lab Test"
Get-Date
Get-Process | Select-Object -First 3 Name, Id
Write-Output $lab
'@

$bytes = [System.Text.Encoding]::Unicode.GetBytes($script)
$encoded = [Convert]::ToBase64String($bytes)
$encoded
I then executed the resulting encoded command:
powershell.exe -EncodedCommand JABsAGEAYgAgAD0AIAAiAFMATwBDACAATABhAGIAIABUAGUAcwB0ACIACgBHAGUAdAAtAEQAYQB0AGUACgBHAGUAdAAtAFAAcgBvAGMAZQBzAHMAIAB8ACAAUwBlAGwAZQBjAHQALQBPAGIAagBlAGMAdAAgAC0ARgBpAHIAcwB0ACAAMwAgAE4AYQBtAGUALAAgAEkAZAAKAFcAcgBpAHQAZQAtAE8AdQB0AHAAdQB0ACAAJABsAGEAYgA=
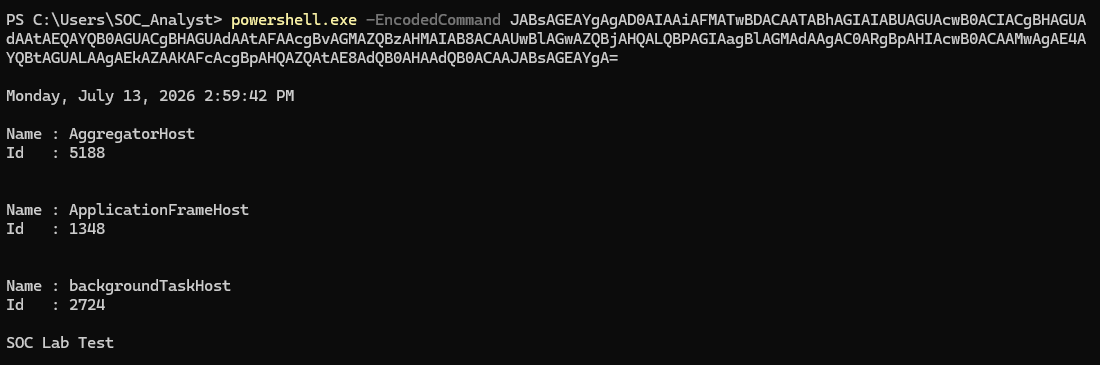
After running the command, I confirmed that Event ID 4104 was being generated. However, although the raw event clearly contained the executed script, Splunk was not extracting it into a dedicated field. As a result, the ScriptBlock column remained empty, making it difficult to search or build detections based on the executed PowerShell code.
Inspecting the raw event showed that the script was stored inside the Message field:
Creating Scriptblock text (1 of 1):

$lab = "SOC Lab Test"
Get-Date
Get-Process | Select-Object -First 3 Name, Id
Write-Output $lab

ScriptBlock ID:
866c089a-d9e0-4827-ac58-9216f2207326
To make the script contents searchable, I created a custom field extraction in Splunk using the following regular expression:
(?s)Creating Scriptblock text \(\d+ of \d+\):\s*(?<ScriptBlock>.*?)\s*ScriptBlock ID:
This extraction captures everything between “Creating Scriptblock text” and “ScriptBlock ID”, storing the result in a new field named ScriptBlock.
Once the extraction was configured, the executed PowerShell code became directly searchable, allowing me to build detections against the script contents rather than performing text searches against the entire Message field.
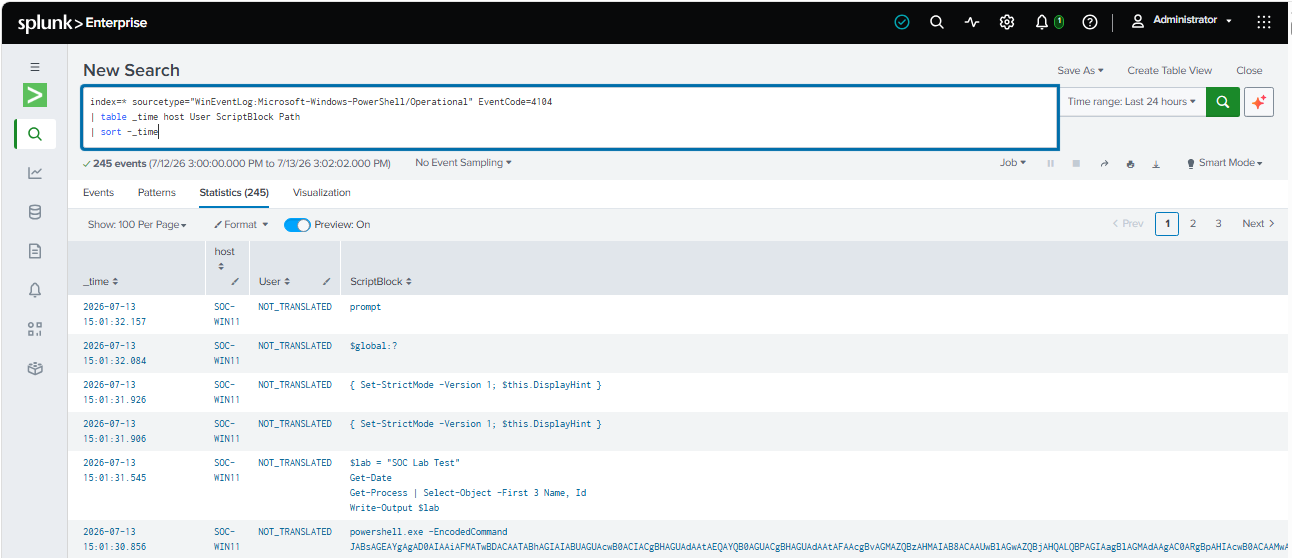
During testing, I also observed that a single PowerShell command generated multiple Event ID 4104 entries. Besides logging the decoded script itself, PowerShell also recorded internal script blocks such as prompt, $global:?, and formatting-related code. This occurs because Script Block Logging records every script block compiled by the PowerShell engine, including internal operations performed by the interactive PowerShell session. Understanding this behavior is important during investigations, as not every 4104 event represents user-authored code.
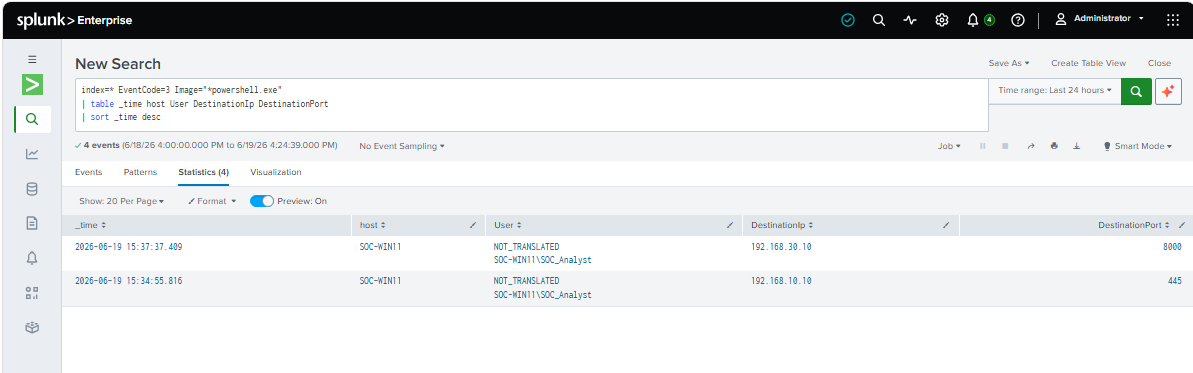
Using Sysmon Event ID 3 (Network Connection), I investigated outbound network connections initiated by PowerShell.
index=* EventCode=3 Image="*powershell.exe"
| table _time host User DestinationIp DestinationPort
Suspicious PowerShell activity was detected on a Windows 11 workstation. The activity included encoded command execution, hidden PowerShell execution, and subsequent network connections.
During a later review of my lab, I wanted to take advantage of PowerShell Script Block Logging (Event ID 4104). While the events were being collected successfully, I discovered that Splunk was not extracting the executed PowerShell code into a dedicated field. I created a custom field extraction to expose the script contents, making future detections and investigations significantly easier.
The following encoded PowerShell execution was observed:
powershell.exe -EncodedCommand ZQBjAGgAbwAgACIAUwBPAEMAIABMAGEAYgAgAFQAZQBzAHQAIgA=
Encoded PowerShell commands use Base64 encoding to obscure command content. While encoding is not inherently malicious, it is frequently used by attackers to evade basic detections and conceal intent.
A second PowerShell execution attempted to hide the PowerShell window from the user:
powershell.exe -WindowStyle Hidden -Command "echo 'hidden test'"
Hidden execution is commonly observed in malware, administrative scripts, and offensive tooling where visibility is intentionally reduced.
The following network-related PowerShell commands were also executed:
Test-NetConnection 192.168.10.10 -Port 445
This command tests connectivity and is commonly used for troubleshooting and administrative tasks.
Invoke-WebRequest http://192.168.30.10:8000
Invoke-WebRequest is widely used by administrators and automation scripts, but it is also frequently abused by attackers to download payloads, retrieve scripts, or communicate with external resources.
After configuring a custom field extraction for Event ID 4104, I was able to review in Splunk the decoded PowerShell script executed by the PowerShell engine.
$lab = "SOC Lab Test"
Get-Date
Get-Process | Select-Object -First 3 Name, Id
Write-Output $lab
Script Block Logging provides visibility into the PowerShell code after it has been parsed, allowing analysts to inspect the actual commands executed even when PowerShell is launched with encoded input.
Network activity occurred shortly after PowerShell execution, indicating a relationship between process execution and outbound network connections.
Destination: 192.168.10.10:445
Connection to the Active Directory server over SMB. The observed command suggests legitimate network connectivity testing.
Destination: 192.168.30.10:8000
Connection initiated through Invoke-WebRequest. While benign in this lab environment, similar activity may warrant further investigation in a production environment because attackers frequently use PowerShell for web-based payload retrieval and command execution.
Encoded PowerShell execution, hidden execution parameters, and associated network activity are all techniques commonly observed during attacker operations.
Although the activity in this investigation was generated as part of a controlled lab exercise, similar behavior in a production environment would warrant analyst review to determine user intent and identify potential malicious activity.
This detection identifies PowerShell executions containing encoded commands or hidden execution parameters.
index=* EventCode=1 Image="*powershell.exe"
(CommandLine="*-EncodedCommand*"
OR CommandLine="*-WindowStyle Hidden*")
| stats count by host User CommandLine ParentImage
This detection uses PowerShell Script Block Logging (Event ID 4104) to identify commonly abused PowerShell functions within executed script blocks.
index=* sourcetype="WinEventLog:Microsoft-Windows-PowerShell/Operational"
EventCode=4104
(
ScriptBlock="*Invoke-WebRequest*"
OR ScriptBlock="*Invoke-Expression*"
OR ScriptBlock="*DownloadString*"
OR ScriptBlock="*FromBase64String*"
OR ScriptBlock="*Net.WebClient*"
)
| stats count by host User ScriptBlock
Together, these detections combine Sysmon process telemetry with PowerShell Operational logging, improving visibility into both how PowerShell was launched and what code it executed.
The simulated activity aligns with several MITRE ATT&CK techniques commonly observed during investigations:
T1059.001 – PowerShell Execution of PowerShell commands on the endpoint.
T1027 – Obfuscated/Encoded Files and Information
Use of the -EncodedCommand parameter to conceal command content.
T1105 – Ingress Tool Transfer
Use of Invoke-WebRequest to retrieve content over HTTP.
While the activity in this lab was benign, these techniques are frequently observed in real-world attacks and are useful candidates for detection and monitoring.
This exercise demonstrated how endpoint telemetry from Sysmon and PowerShell logging can be correlated in Splunk to investigate suspicious activity.
By analyzing process creation events, command-line arguments, parent processes, and network connections, I was able to identify common PowerShell abuse techniques and create a simple detection rule that could assist SOC analysts during triage and investigation.
The lab also reinforced the importance of combining multiple telemetry sources to build context around potentially suspicious behavior rather than relying on a single event in isolation.
A detection-engineering exercise using Sigma, Splunk, Windows telemetry, and Atomic Red Team to validate vendor-neutral detection logic
How to Validate PowerShell Detections in Splunk with Sysmon, Atomic Red Team, and MITRE ATT&CK
Designing an Operational Monitoring Dashboard for Authentication, Endpoint, Network, and Threat Hunting Visibility