

From Splunk to Sigma: Building and Validating Vendor-Neutral Detection Logic
A detection-engineering exercise using Sigma, Splunk, Windows telemetry, and Atomic Red Team to validate vendor-neutral detection logic


Building a SOC homelab is often presented as a straightforward process: install a few virtual machines, configure logging, connect everything to a SIEM, and start investigating events.
In reality, the deployment process involved far more troubleshooting than installation.
Throughout the project I encountered multiple issues affecting log collection, DNS resolution, network segmentation, time synchronization, endpoint visibility, and Splunk ingestion. Each problem required investigation, validation, and remediation before the environment became operational.
This article documents the most valuable challenges I faced and the lessons learned while solving them.
After installing Sysmon on both the Active Directory server and the Windows 11 workstation, I expected to see Sysmon events flowing into Splunk.
Instead, only the standard Windows Event Logs were being received.
The following log sources appeared normally:
However, Sysmon events were completely absent.
This represented a significant visibility gap because Sysmon provides many of the endpoint telemetry sources commonly used for threat detection and investigations.
I started by determining whether the issue originated at the endpoint or somewhere within the logging pipeline.
Using Event Viewer, I confirmed that Sysmon was successfully generating events locally. Since the events existed on the endpoint, I ruled out installation and configuration issues with Sysmon itself.
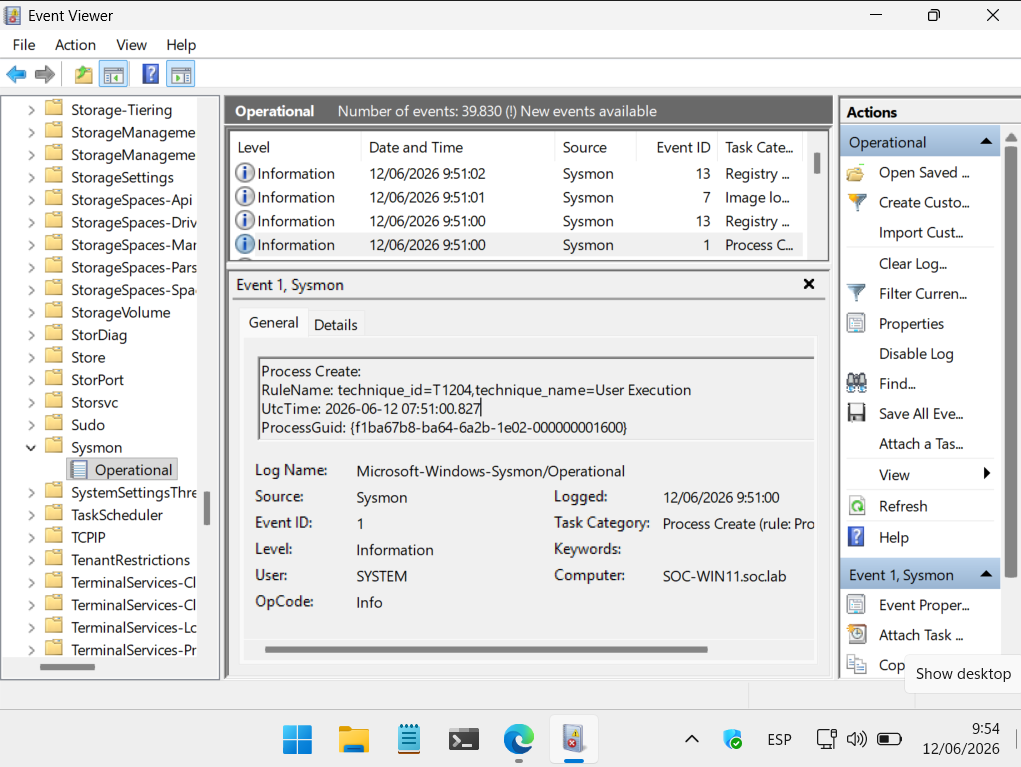 Sysmon logs visible in Event Viewer
Next, I reviewed the Splunk Universal Forwarder configuration and verified that the Sysmon Operational log channel had been included alongside the Security, System, and Application logs.
Because the standard Windows logs were arriving in Splunk successfully, I eliminated network connectivity and forwarding configuration as likely causes and focused my investigation on permissions affecting access to the Sysmon log source.
The Splunk Universal Forwarder service was running under an account that did not have sufficient permissions to access the Sysmon Operational log channel.
As a result, the forwarder could successfully read standard event logs but could not access Sysmon events.
I modified the service configuration and changed the account used by the Splunk Universal Forwarder.
After restarting the service, Sysmon events immediately began appearing in Splunk.
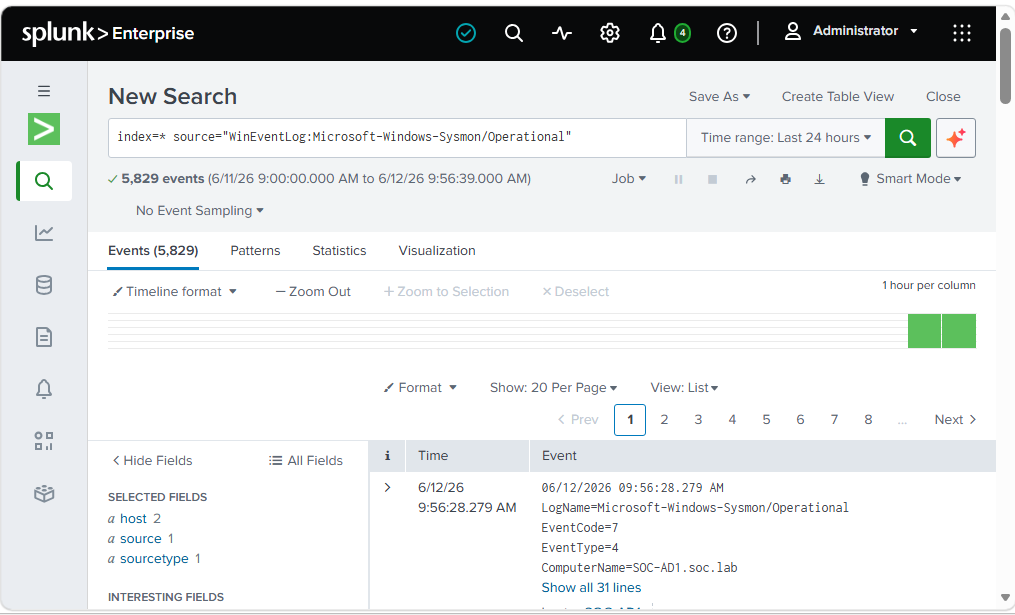 Sysmon logs appearing in Splunk after fix
After restarting the Splunk Universal Forwarder service, Sysmon events began appearing in Splunk as expected.
I verified the successful ingestion of process creation events and confirmed that new endpoint activity was being captured correctly.
When troubleshooting missing logs, it is important to verify:
Visibility problems often originate from permissions rather than application failures.
As additional systems were added to the lab, event timestamps became inconsistent.
When reviewing events in Splunk, some records appeared out of sequence even though they were related to the same activity.
This made correlation and timeline analysis difficult.
The issue first became apparent while reviewing events in Splunk. Activities that should have appeared sequentially were sometimes displayed out of order, making correlation more difficult.
To identify the source of the problem, I compared timestamps across pfSense, Debian, Windows Server, and Windows 11.
Because the issue affected multiple systems simultaneously, I suspected a configuration inconsistency rather than an isolated clock problem. Reviewing the time settings confirmed differences in synchronization methods and timezone configuration between systems.
The systems were using different synchronization mechanisms and time zone configurations.
Virtualized environments can also introduce clock drift if synchronization is not configured consistently.
I standardized:
After normalizing the configuration across all systems, event timestamps aligned correctly.
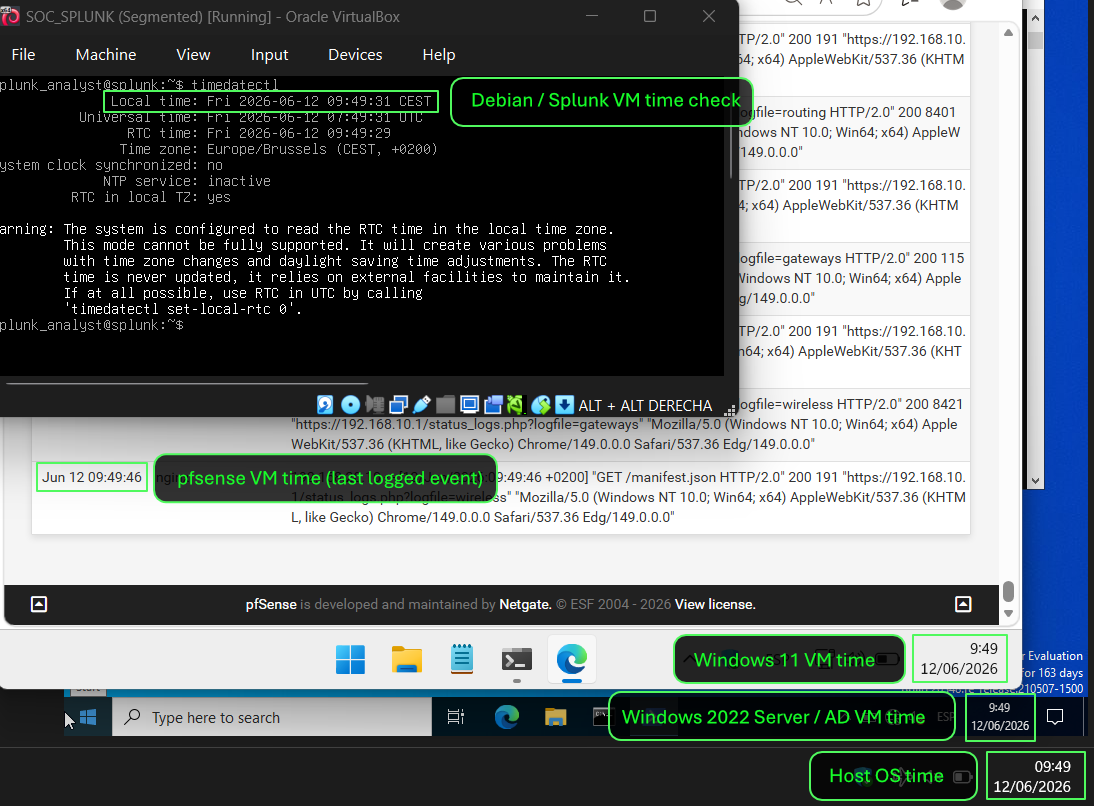 All systems synchronized
Accurate timestamps are critical for:
A SIEM is only as reliable as the timestamps of the data it receives.
One of my goals was to emulate a more realistic enterprise environment.
Initially, clients could potentially resolve DNS externally instead of relying on Active Directory.
This would reduce visibility and bypass centralized name resolution.
My goal was to ensure that all DNS activity followed a predictable path through the environment.
I reviewed the DNS configuration on the workstation, domain controller, and pfSense firewall and mapped the flow of requests between each component.
This process allowed me to verify where name resolution was occurring and identify any opportunities for clients to bypass the intended DNS architecture.
I configured Active Directory as the primary DNS server for all Windows systems.
I then configured DNS forwarding from Active Directory to pfSense.
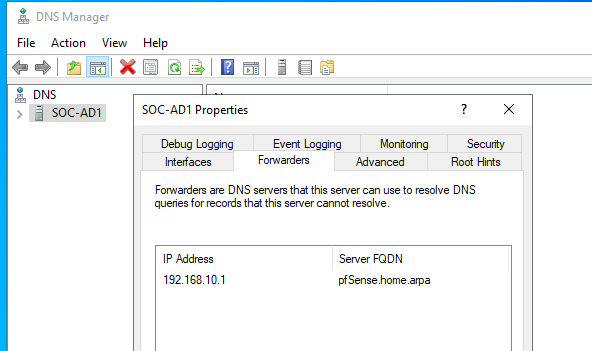 DNS Forwarder configuration on AD
Finally, I created firewall rules on pfSense to:
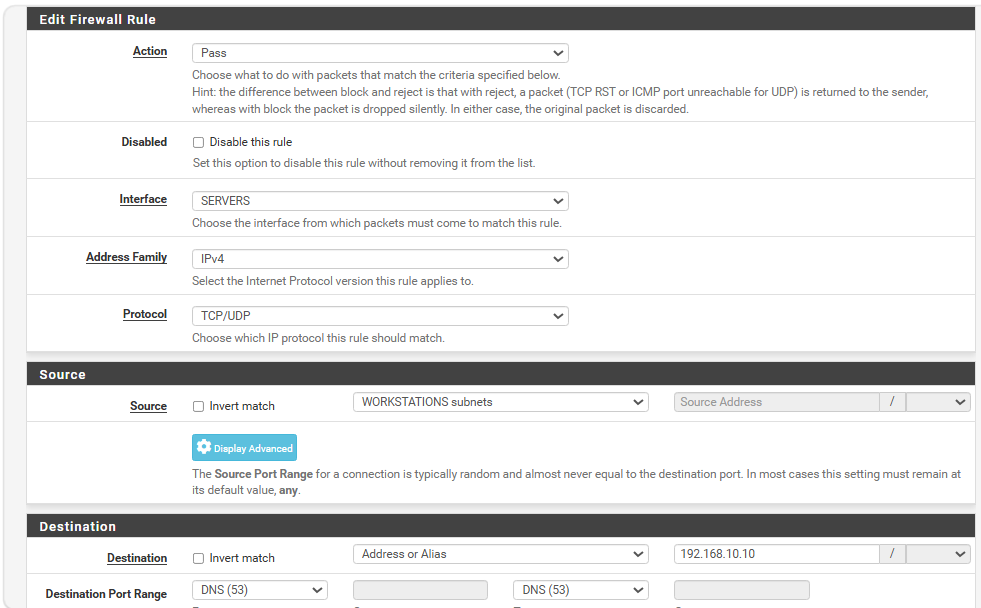 Firewall rule allowing DNS queries from WORKSTATIONS subnet to Active Directory’s IP
The resulting architecture ensured:
Security monitoring improves when network services follow predictable and controlled paths.
The more telemetry that can be centralized, the easier investigations become.
The initial version of the lab was deployed within a single subnet. While this simplified connectivity, it did not accurately reflect how enterprise environments are typically structured.
A flat network also reduced opportunities to practice firewall management, network troubleshooting, and the analysis of blocked communications.
To create a more realistic environment, I decided to separate the infrastructure into dedicated network segments:
After implementing the new subnets, communication between systems immediately stopped working.
Services that had previously functioned without issue, including DNS resolution, Splunk access, and host-to-host communication, began failing.
The first step was determining whether the issue originated from routing, firewall policy, or endpoint configuration.
I validated:
One of the most useful discoveries was that pfSense blocks inter-subnet traffic by default unless explicit firewall rules are created.
To isolate the problem, I temporarily created permissive firewall rules and verified that communication immediately resumed. This confirmed that routing was functioning correctly and that the issue was related to firewall policy.
The newly created network segments had no rules allowing the required traffic between systems.
Although the hosts were correctly configured and could reach their local gateways, pfSense was enforcing segmentation and blocking communications between subnets.
This behavior was expected from a security perspective but required the creation of explicit allow rules for legitimate business traffic.
I implemented firewall rules based on the operational requirements of the environment.
Examples included:
After validating functionality, the temporary allow-all rules were removed and replaced with more restrictive policies.
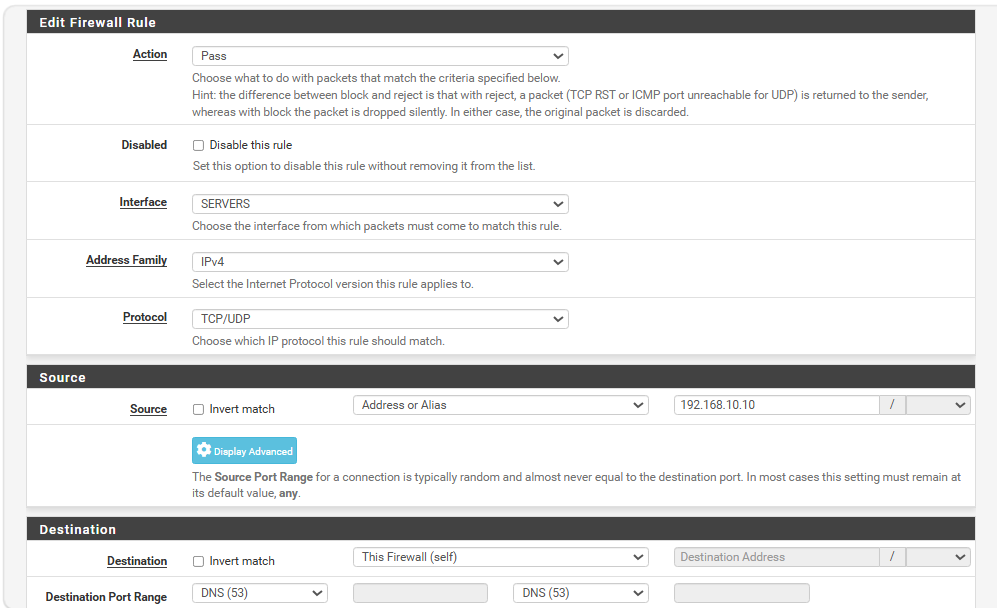 Firewall rule allowing Active Directory’s IP to forward DNS requests to pfSense
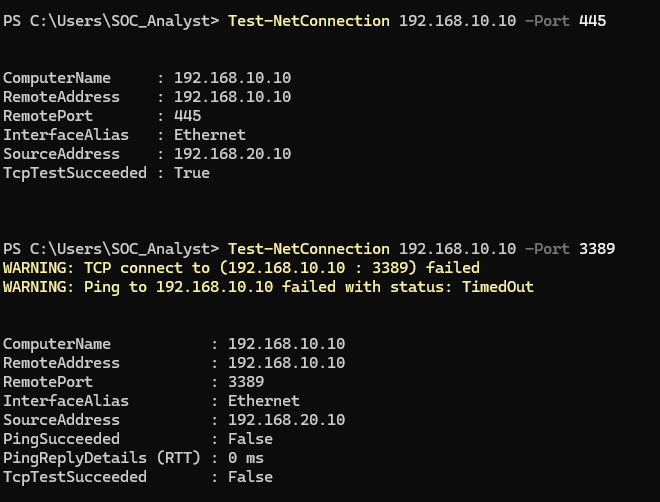
To verify that segmentation was functioning correctly, I tested both allowed and blocked communications.
Examples included:
Test-NetConnection 192.168.10.10 -Port 445

Test-NetConnection 192.168.10.10 -Port 3389
SMB connectivity succeeded because it was explicitly allowed, while RDP traffic was denied because no corresponding firewall rule existed.
This confirmed that the segmentation policy was operating as intended.
 Commands testing SMB & RDP connectivity and their output
Network segmentation directly contributes to security monitoring. By controlling communication paths through firewall policy, it becomes possible to:
The troubleshooting process also reinforced the importance of testing connectivity systematically and validating assumptions before modifying configurations.
A freshly deployed Active Directory environment contains very little activity.
This creates a challenge when attempting to develop detection and investigation skills because there are few events to analyze.
I wanted the environment to generate:
Without these events, Splunk would contain little meaningful telemetry.
I deployed the BadBlood PowerShell project to populate Active Directory with realistic objects and relationships.
The environment immediately became more representative of a real enterprise domain.
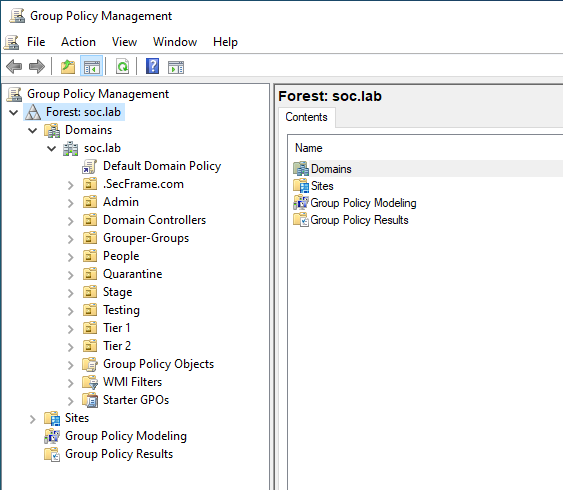 Active Directory after BadBlood population
A useful SOC lab requires realistic data.
Security monitoring becomes significantly more valuable when the environment generates authentic activity patterns.
Native Windows logging provides useful information, but it does not always provide the level of detail required for detection engineering and investigations.
I wanted deeper visibility into endpoint activity.
I deployed Sysmon using Olaf Hartong’s modular configuration and enabled PowerShell logging on both Windows systems.
The combination provided visibility into:
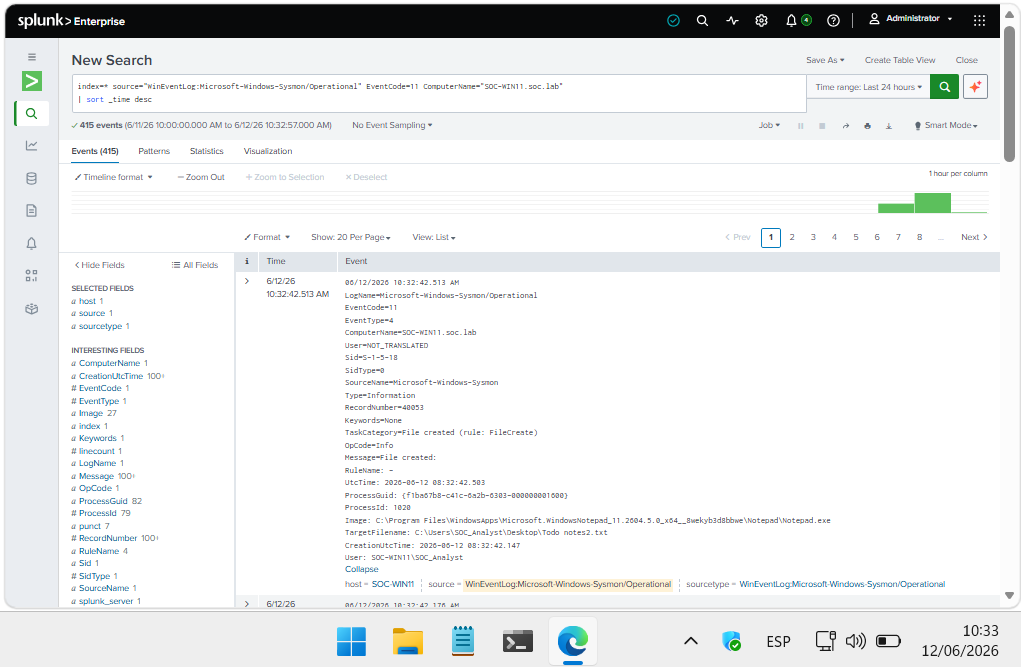 Sysmon detailed events such as 11 (File Creation) appearing in Splunk
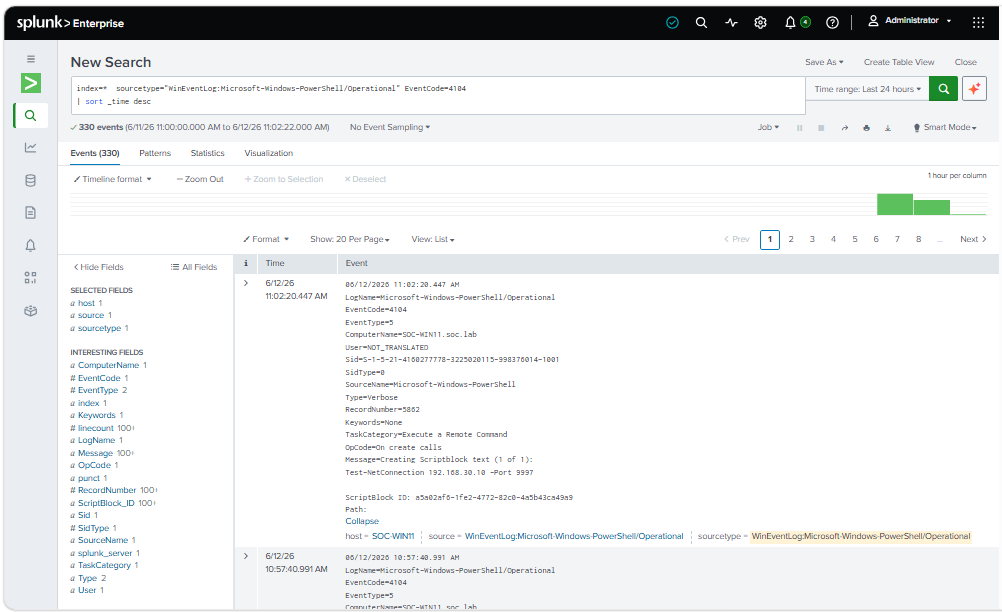 PowerShell detailed events such as 4104 (Script Block) appearing in Splunk
The resulting telemetry significantly improved the quality of data available within Splunk.
This created a stronger foundation for future detection engineering and threat hunting exercises.
Several lessons emerged from this project:
Always determine whether the issue originates from:
Reliable timestamps are essential for investigations and event correlation.
Useful telemetry does not appear automatically. It requires deliberate configuration and validation.
Implementing controls such as network segmentation and firewall policies not only improves security but also generates valuable data for monitoring and investigations.
Blocked connections, denied access attempts, and unusual communication patterns can all become useful detection opportunities within a SIEM.
Tools such as BadBlood help transform a lab from a static environment into a platform for meaningful security analysis.
Many of the most valuable lessons from this project came from solving problems rather than completing installations.
Building this SOC homelab provided practical experience not only in deploying security tools, but in operating and troubleshooting a realistic security monitoring environment.
The most valuable learning came from resolving unexpected issues across log collection, DNS architecture, network segmentation, endpoint telemetry, and system synchronization. Each challenge required understanding how different components interact within a security pipeline.
This foundation will support future work in detection engineering, threat hunting, and security incident analysis.
With the environment now fully operational, the next step is to build detection logic, simulate adversarial activity, and develop structured investigation workflows using Splunk.
A detection-engineering exercise using Sigma, Splunk, Windows telemetry, and Atomic Red Team to validate vendor-neutral detection logic
How to Validate PowerShell Detections in Splunk with Sysmon, Atomic Red Team, and MITRE ATT&CK
Exploring the new skills, technologies and investigative mindset behind TryHackMe's updated L2 curriculum