
From Splunk to Sigma: Building and Validating Vendor-Neutral Detection Logic
A detection-engineering exercise using Sigma, Splunk, Windows telemetry, and Atomic Red Team to validate vendor-neutral detection logic


This article continues my investigation of the TryHackMe First Shift CTF room, focusing on Task 8 — Promotion Night. Building on the network-based compromise analyzed in Task 7 (The Crown Jewel), this stage transitions into a ransomware incident response scenario, requiring a broader analytical approach across host, network, and cloud telemetry.
In this task, I investigate attacker activity across multiple stages of the intrusion, including:
The analysis is performed using Splunk logs, simulating the type of telemetry a SOC analyst would work with during a real-world incident.
A critical alert appeared:
“Potential Ransom Note on DC-01”
A ransomware attack has been deployed — and cloud resources may be compromised.
Tools provided:
A Splunk instance containing the scenario index
Required:
Process:
To identify where the ransomware originated, I began by searching for file creation events using Sysmon (EventCode=11). This helps surface newly written files and the processes responsible for them.
Query #1:
index="scenario" EventCode=11
| table _time TargetFilename Image
| sort _time
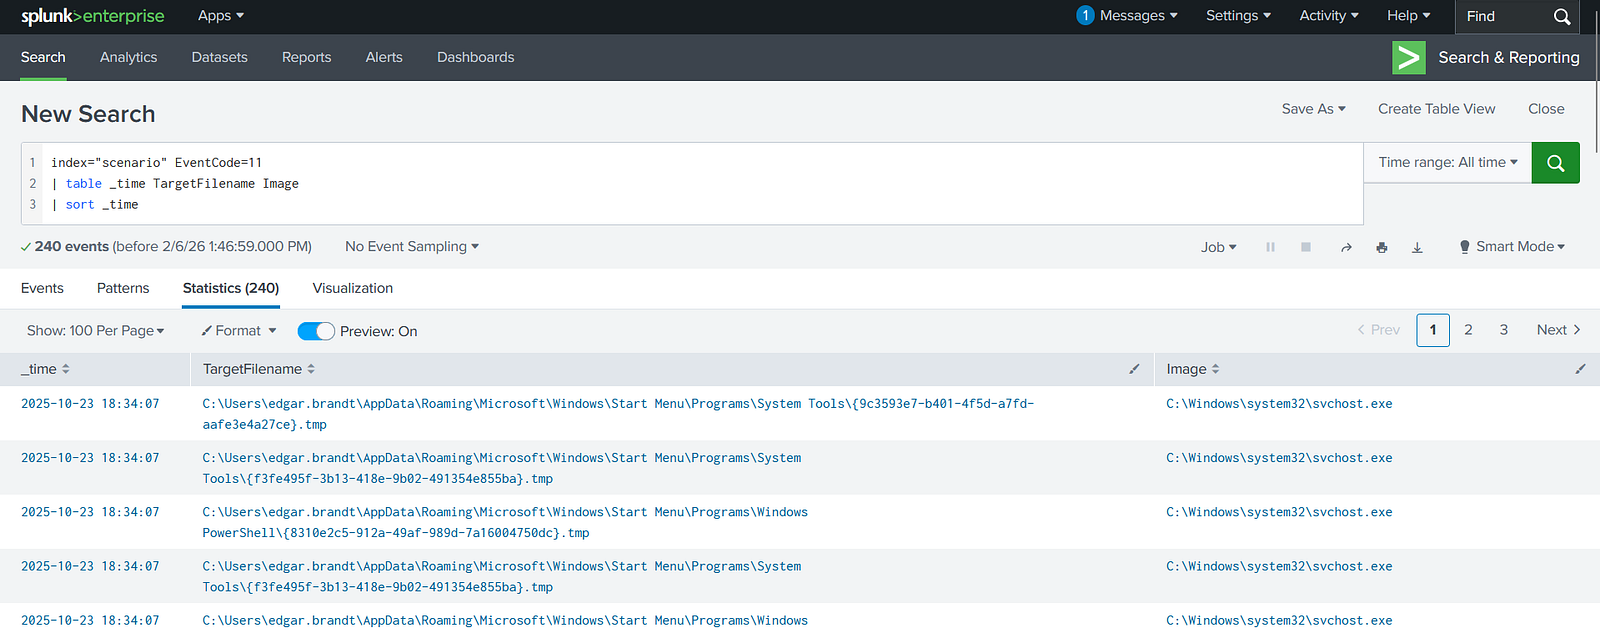
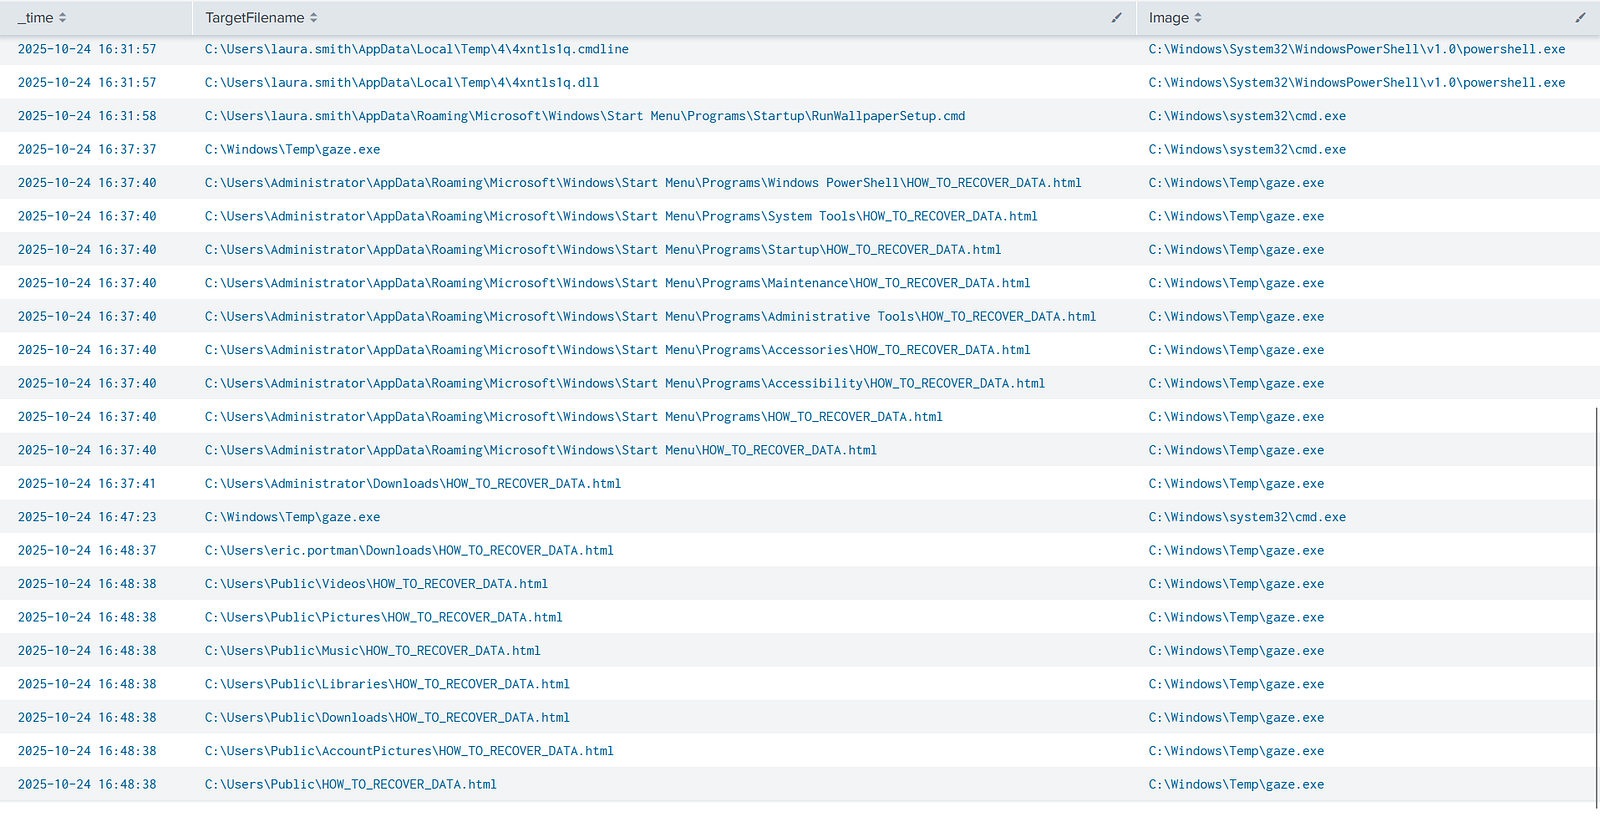
While reviewing the results, I observed repeated activity involving an executable named gaze.exe located in a suspicious directory (Temp). The files it created resembled ransom note artifacts, which strongly indicated malicious behavior.
To further investigate, I pivoted to all events related to this executable.
Query #2:
index="scenario" gaze.exe
| sort _time
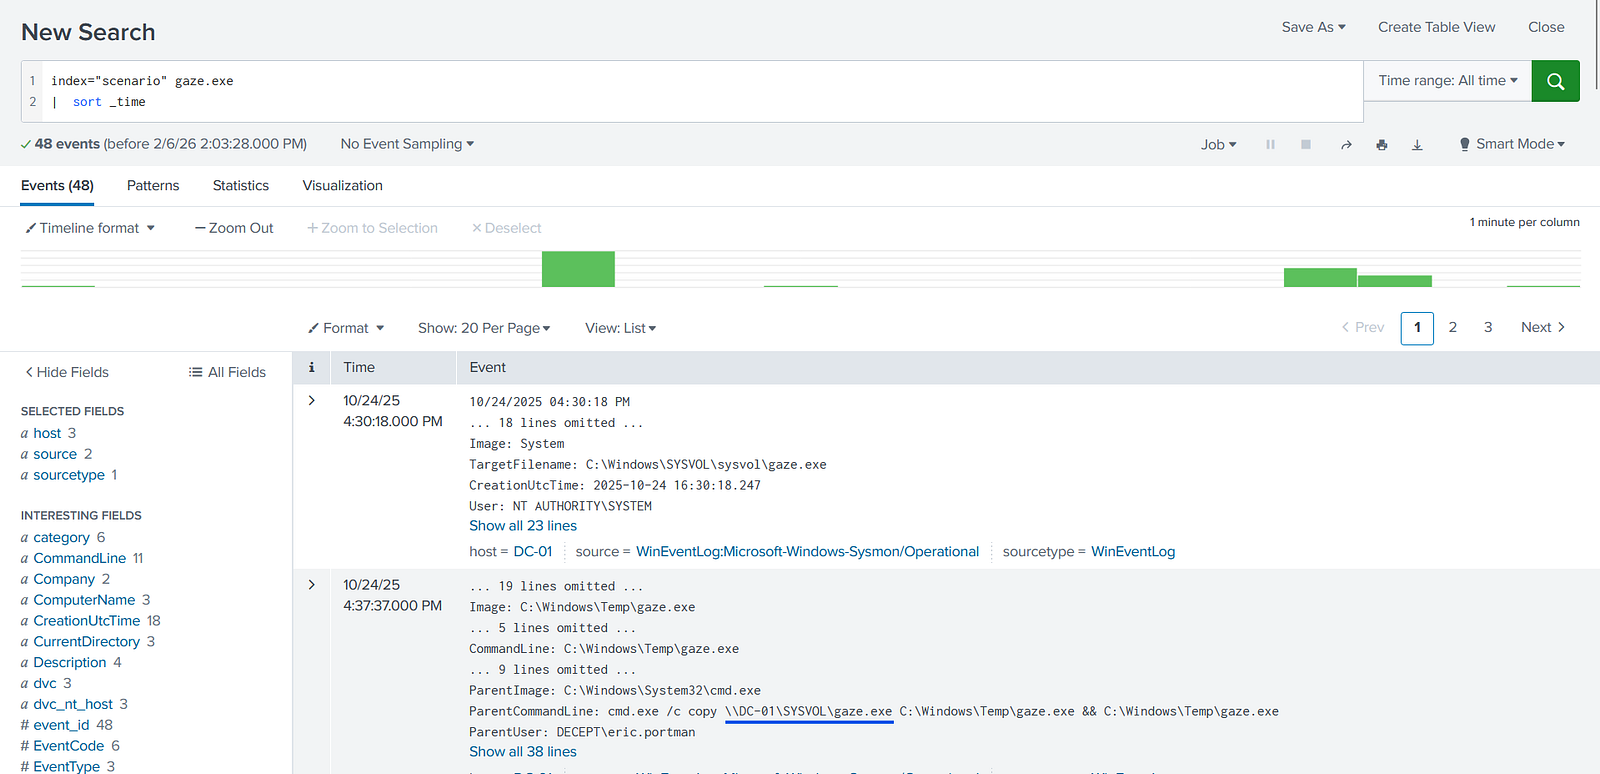
This revealed a command showing the original location of the ransomware on a network share.
Answer:\\DC-01\SYSVOL\gaze.exe
Insights:
The command:
cmd.exe /c copy \\DC-01\SYSVOL\gaze.exe C:\Windows\temp.gaze.exe && C:\Windows\temp.gaze.exe
demonstrates a classic living-off-the-land (LOLBins) technique using cmd.exe to copy and execute malware.
From a SOC perspective, this highlights:
Process:
To identify persistence mechanisms, I searched for registry modification events (EventCode 12, 13, 14) associated with the ransomware process.
Query:
index="scenario" EventCode IN (12,13,14) Image="C:\\Windows\\Temp\\gaze.exe"
| sort _time
This revealed a new registry entry under the Run key.
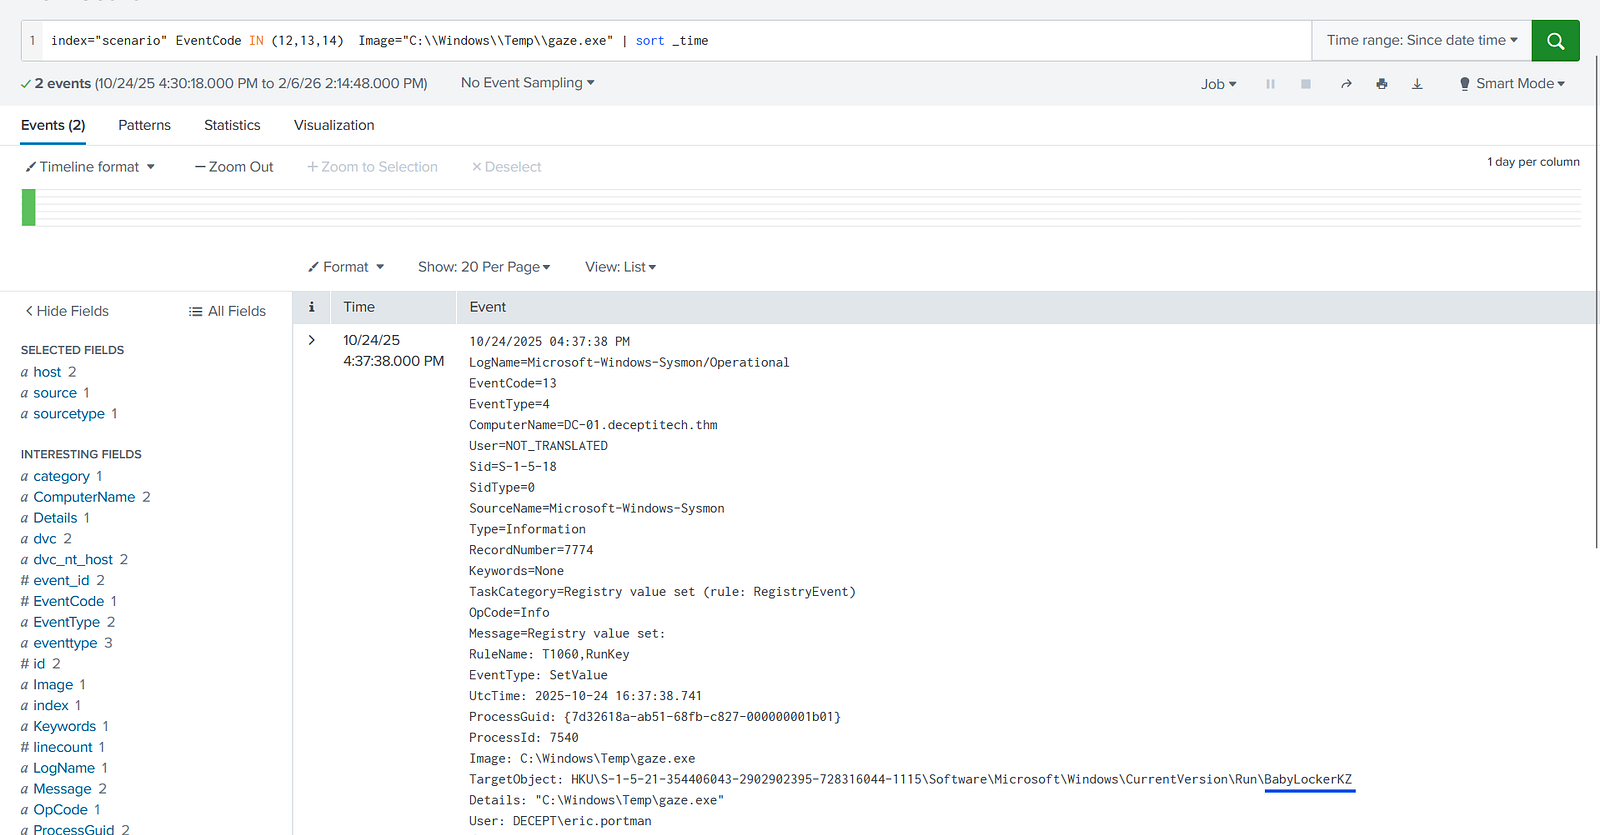
Answer: BabyLockerKZ
Insights:
Registry Run keys are a common persistence mechanism used by malware to ensure execution at system startup.
Detection opportunities:
HKLM\Software\Microsoft\Windows\CurrentVersion\RunHKCU\Software\Microsoft\Windows\CurrentVersion\RunHKLM\Software\Microsoft\Windows\CurrentVersion\RunOnceHKCU\Software\Microsoft\Windows\CurrentVersion\RunOnceProcess:
I first identified the ransomware hash via process execution logs.
Query:
index="scenario" gaze.exe EventCode=1
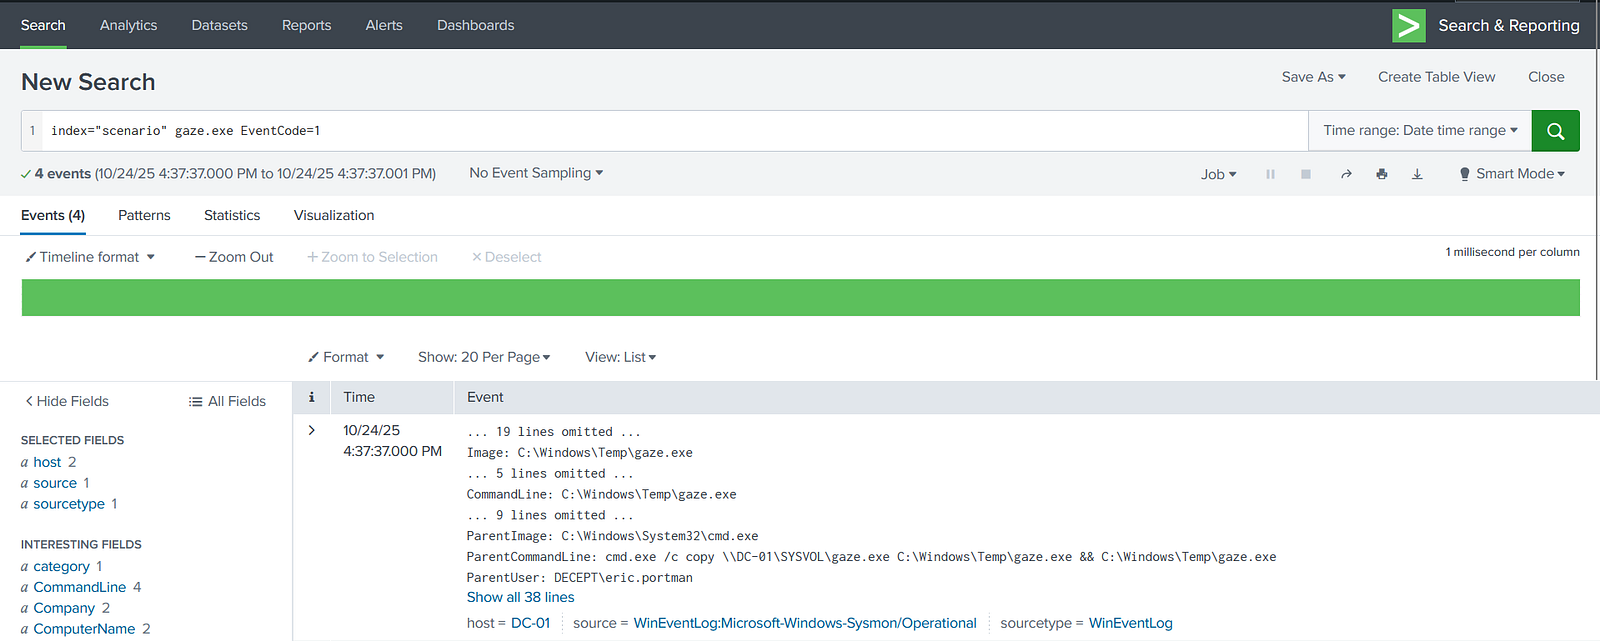
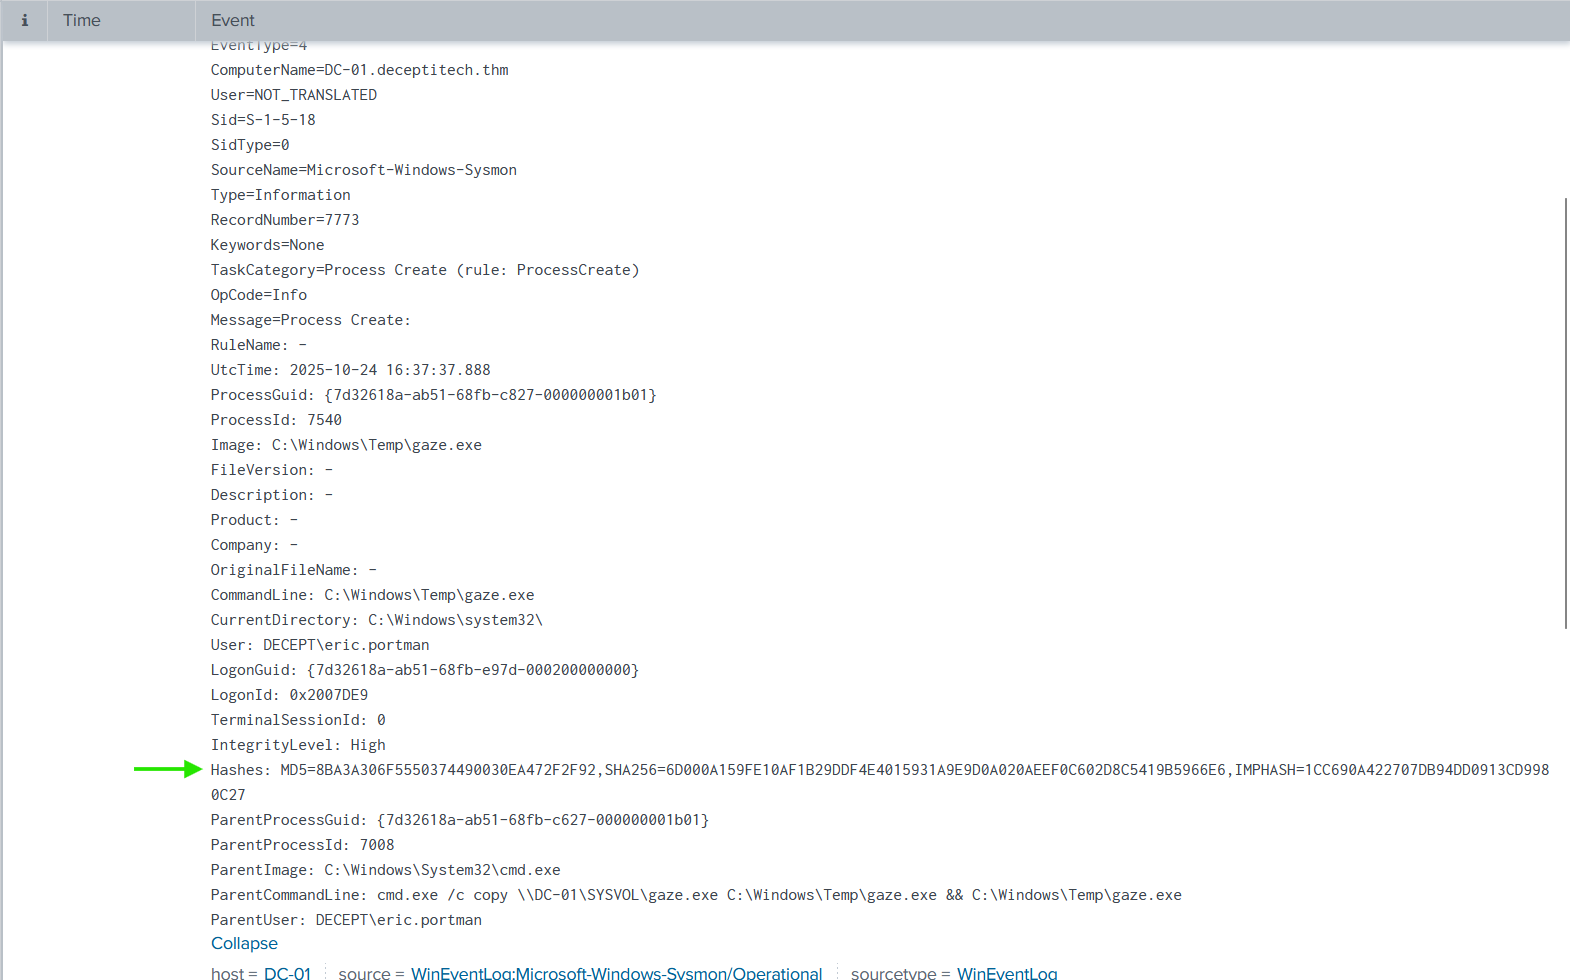
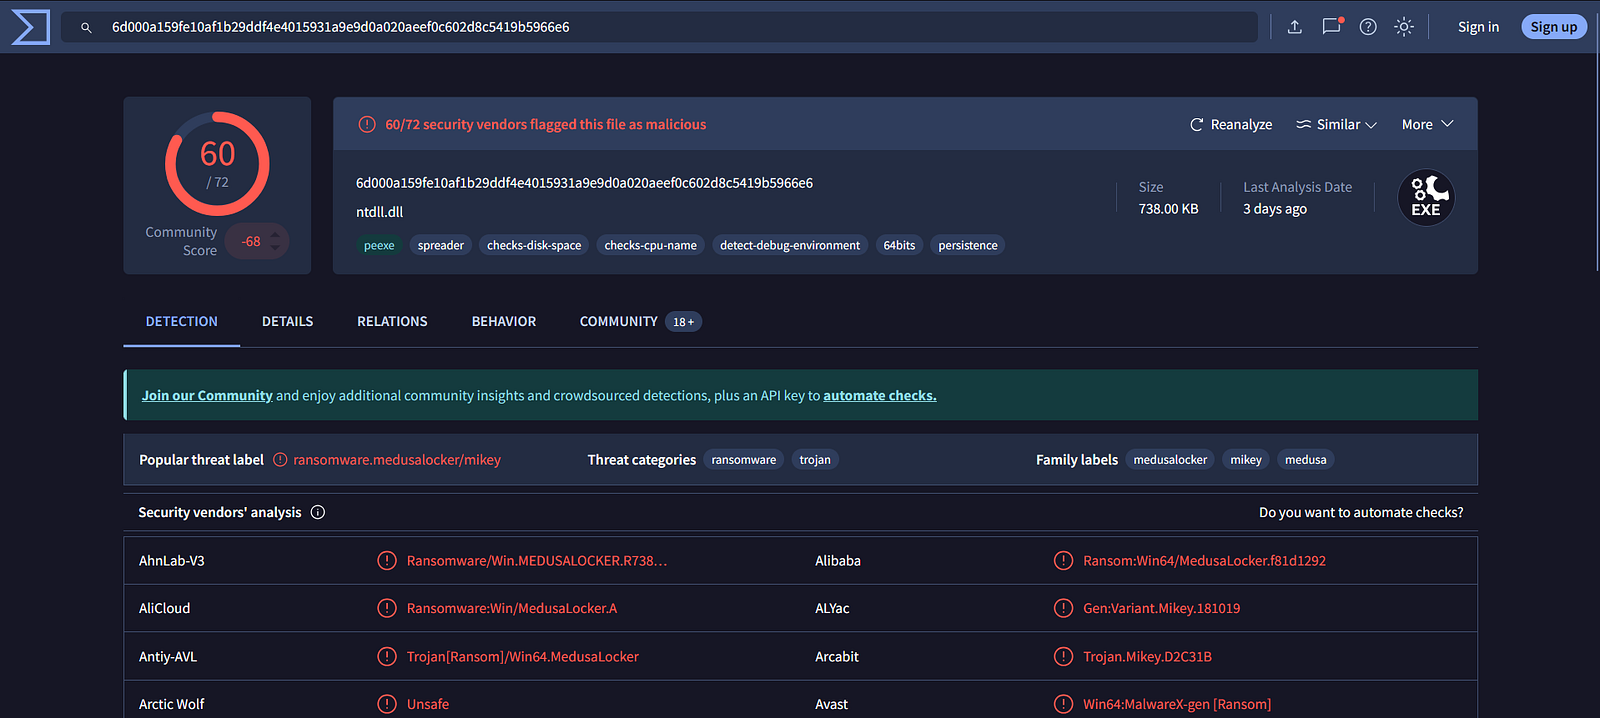
Using this hash, I conducted external threat intelligence analysis (VirusTotal, MalwareBazaar, CAPE Sandbox). Correlating multiple reports revealed that the sample aligns with Medusa Locker–type ransomware behavior.
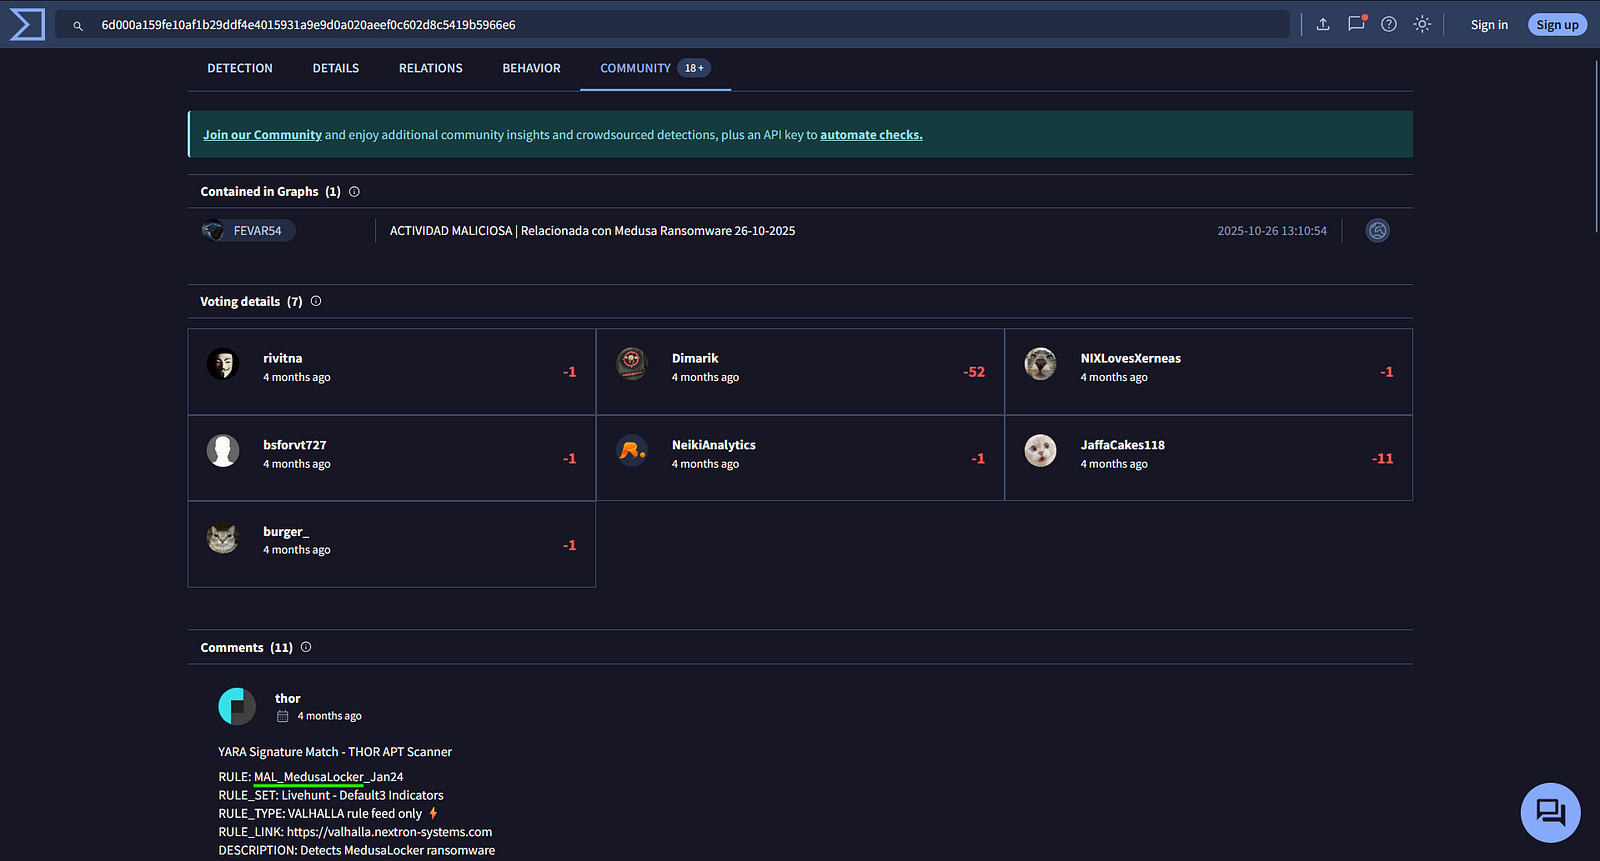
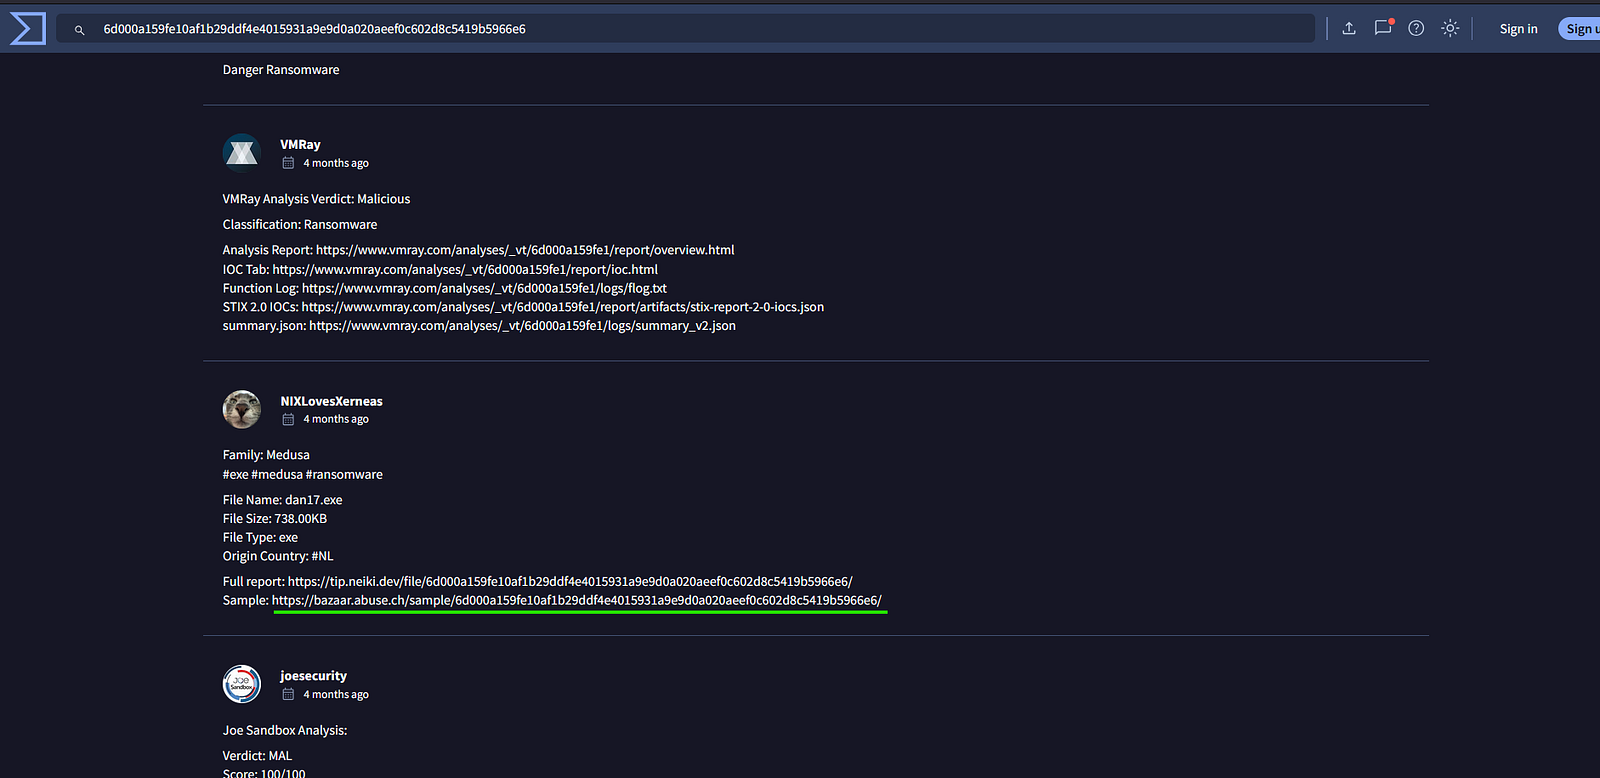
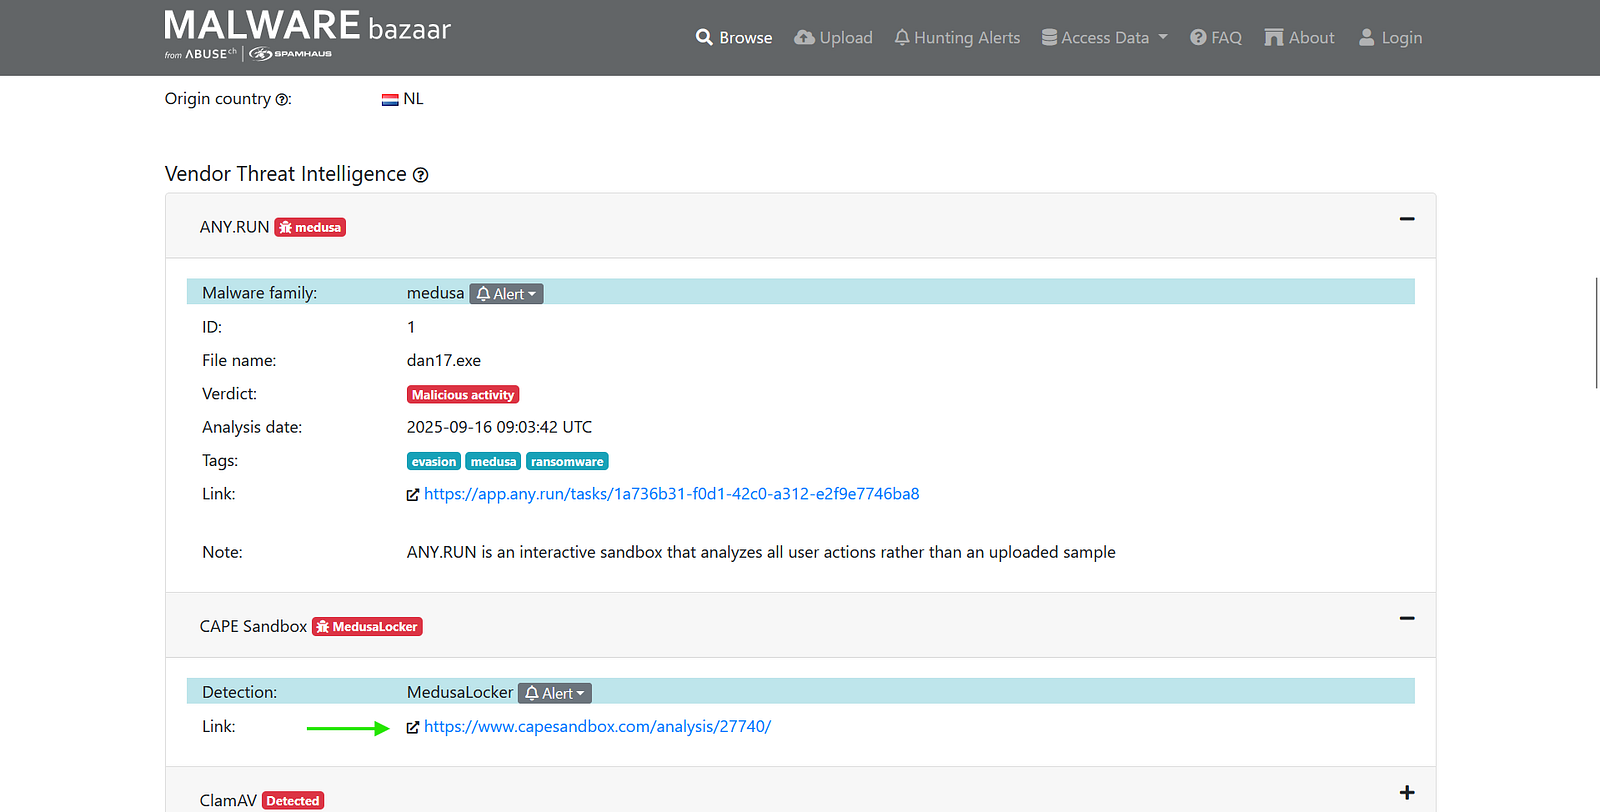
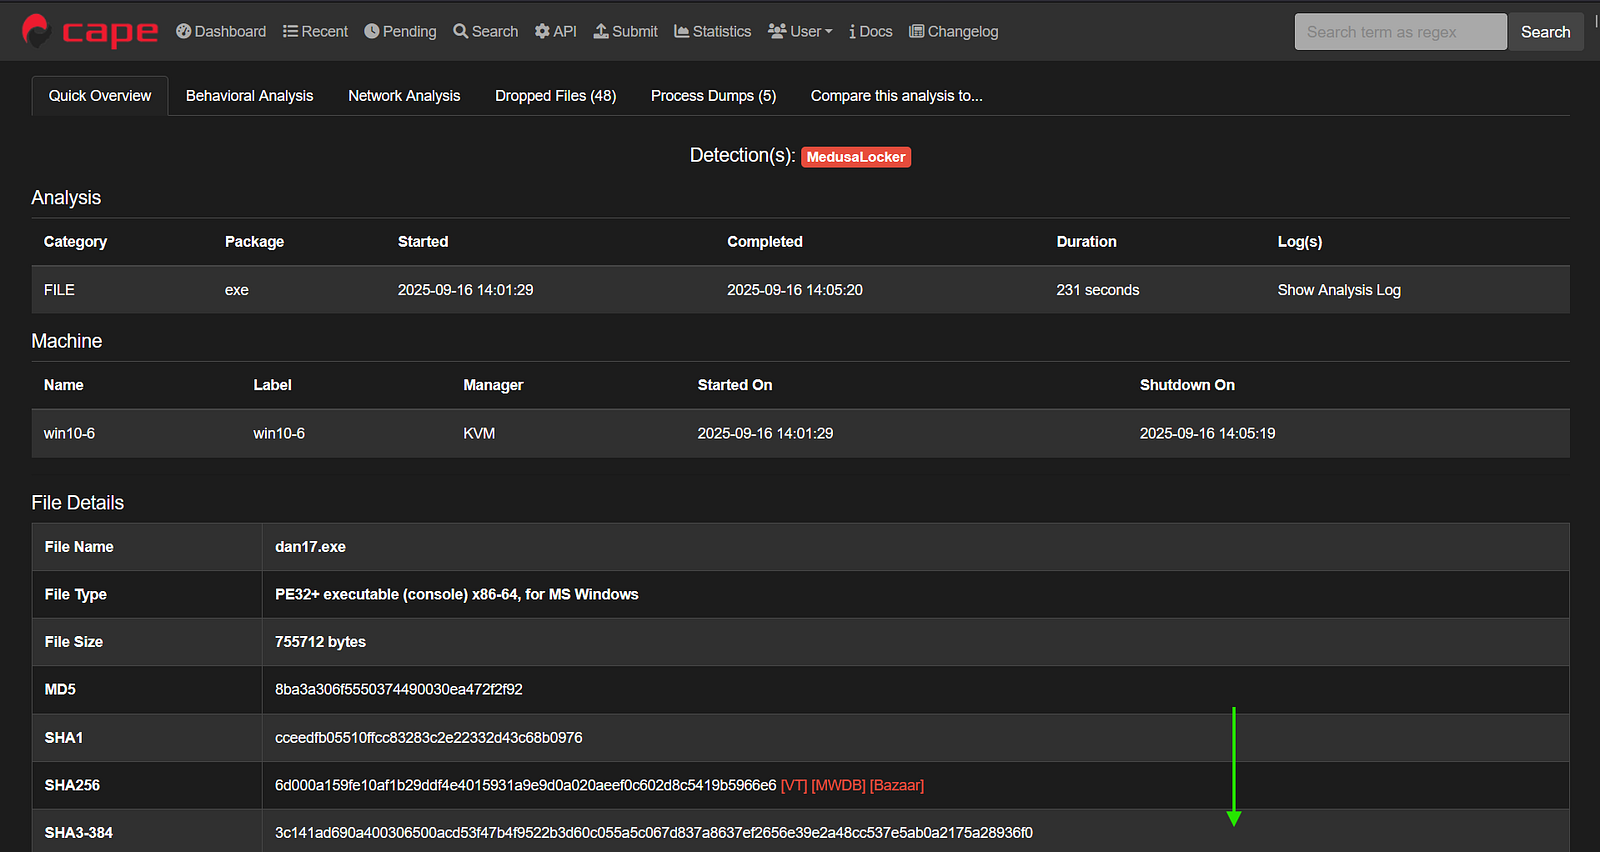
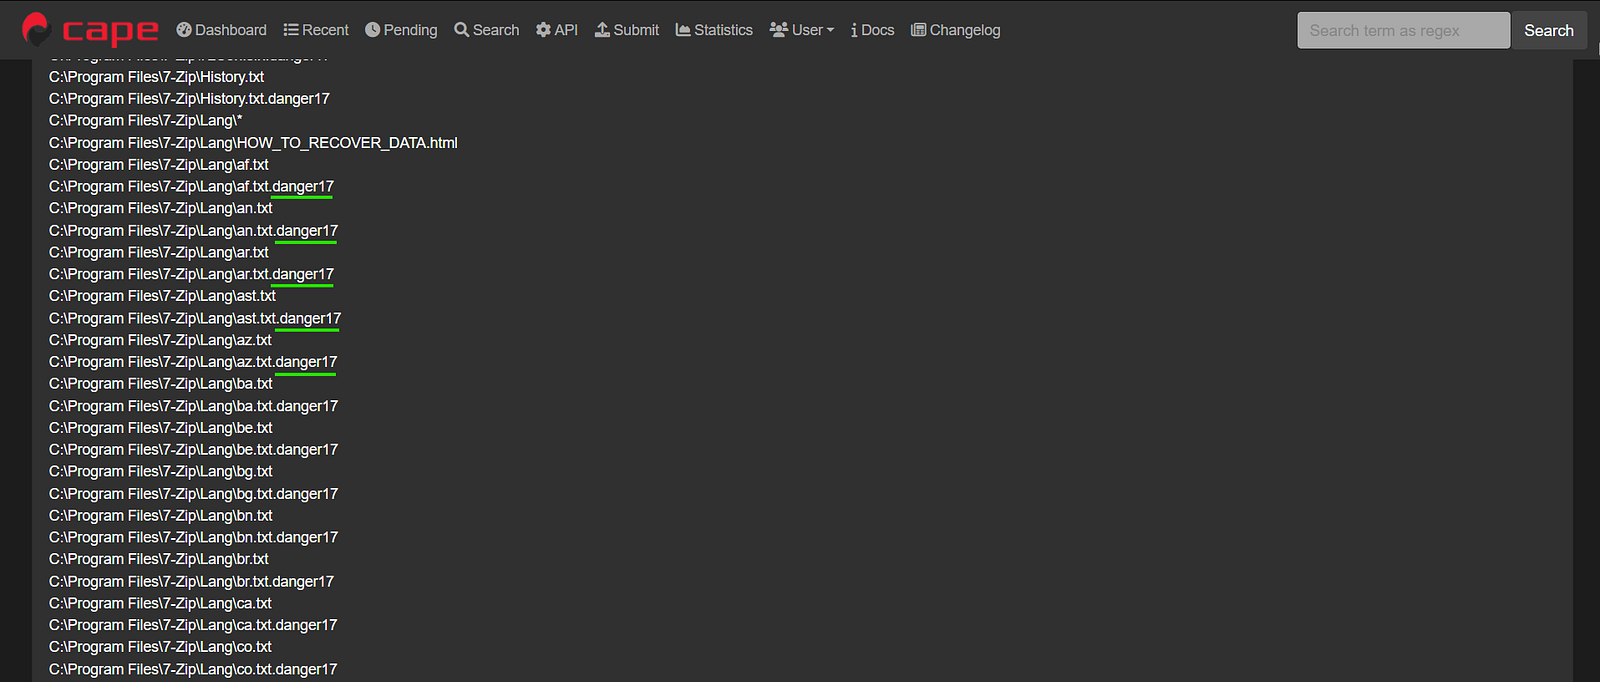
From sandbox reports, I identified the file extension used after encryption.
Answer: .danger17
Insights:
Threat intelligence enrichment is critical in SOC workflows:
Process:
I searched for command-line execution activity around the time of ransomware deployment.
Query:
index="scenario" EventCode=1 CommandLine=*
| table _time CommandLine
| sort -_time

This revealed the use of wmic to execute commands remotely.
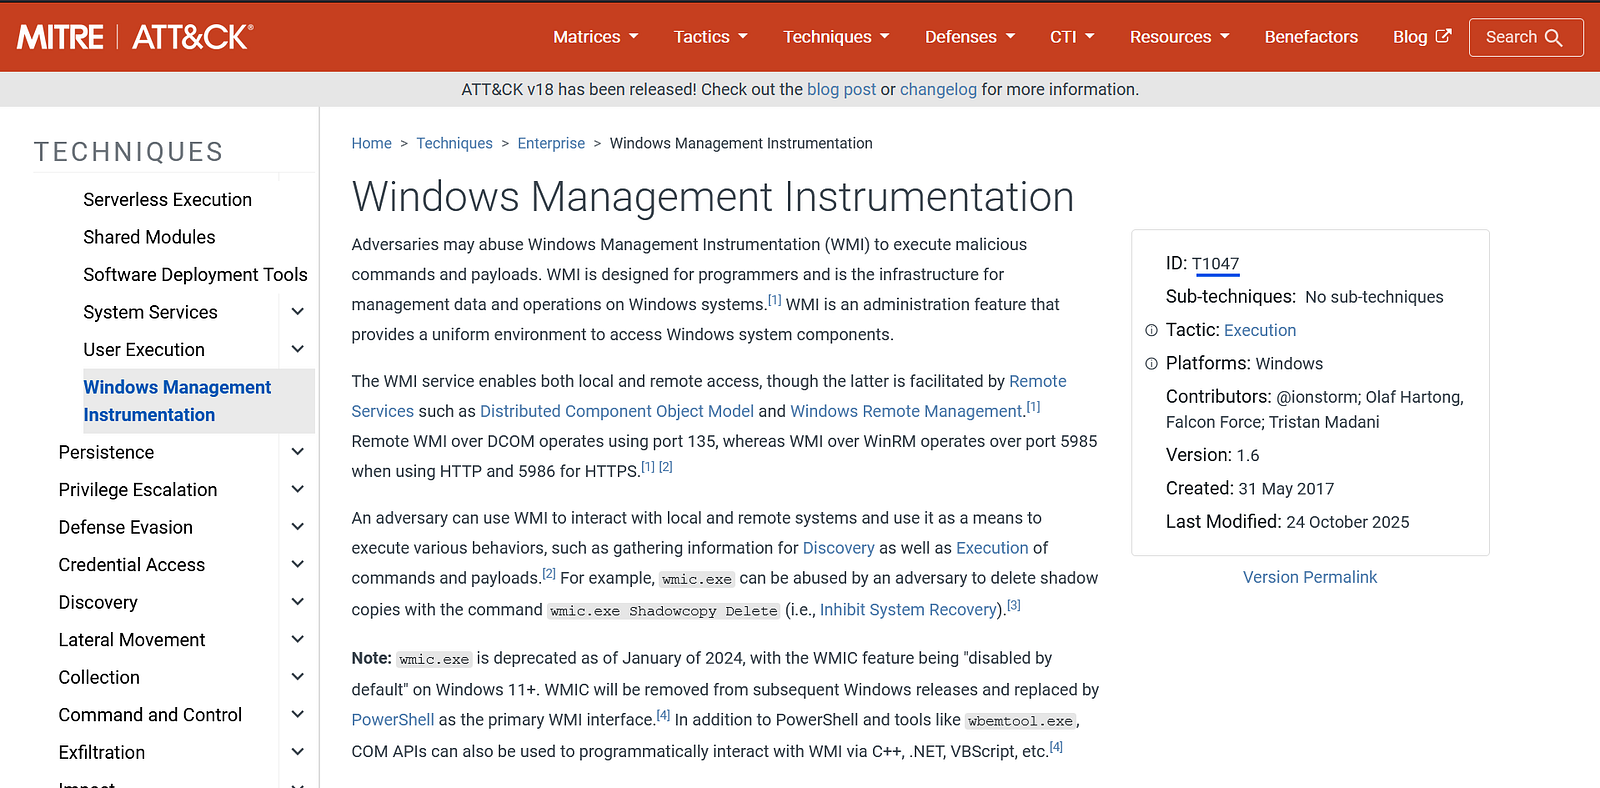
Answer: T1047
Insights:
Windows Management Instrumentation (WMI) is commonly abused for:
This is a strong indicator of post-compromise activity and should be closely monitored.
Process:
I started by creating a query which narrowed down all activity log entries to those:
Then I used a | chart command to visualize DestinationIp and DestinationPort values.
Query #1:
index="scenario" host="SRV-JMP" user="eric.portman" OR User IN ("DECEPT\\eric.portman", "eric.portman") SourceHostname="SRV-JMP.deceptitech.thm"
| chart count over DestinationIp By DestinationPort limit=0
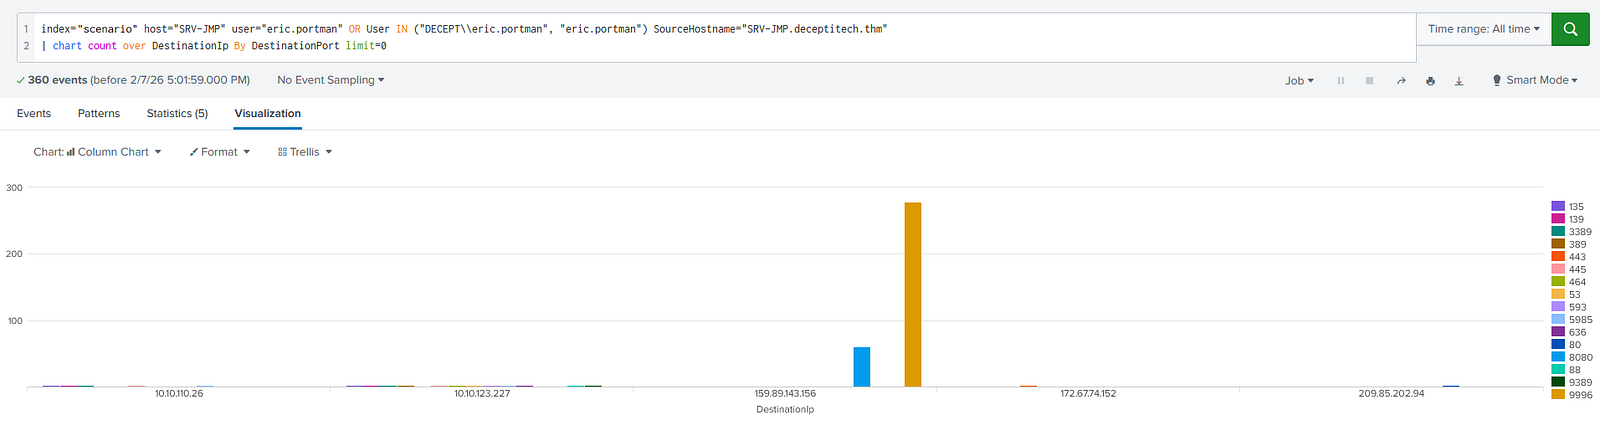
This showed high activity on ports 8080 and 9996, which appeared to be related to C2 and exfiltration traffic and were overshadowing other results.
So I refined the query by excluding these ports.
Query #2:
index="scenario" host="SRV-JMP" user="eric.portman" OR User IN ("DECEPT\\eric.portman", "eric.portman") SourceHostname="SRV-JMP.deceptitech.thm" DestinationPort!="9996" DestinationPort!="8080"
| chart count over DestinationIp By DestinationPort limit=0
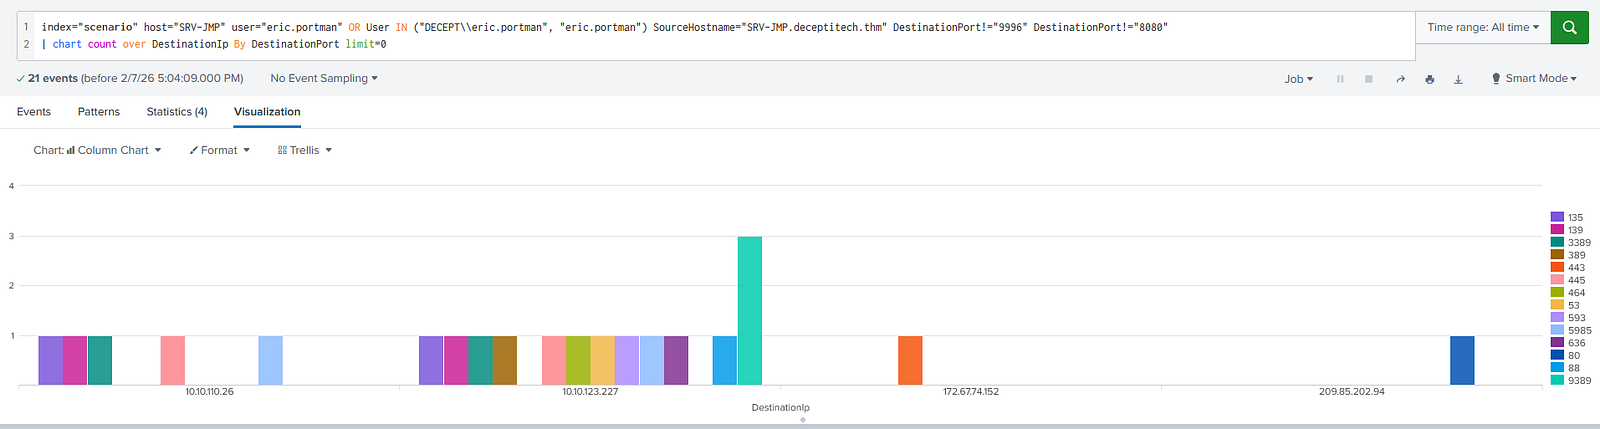
This made internal activity against 10.10.110.16 (SRV-ITFS) more visible, showing multiple scanned ports.
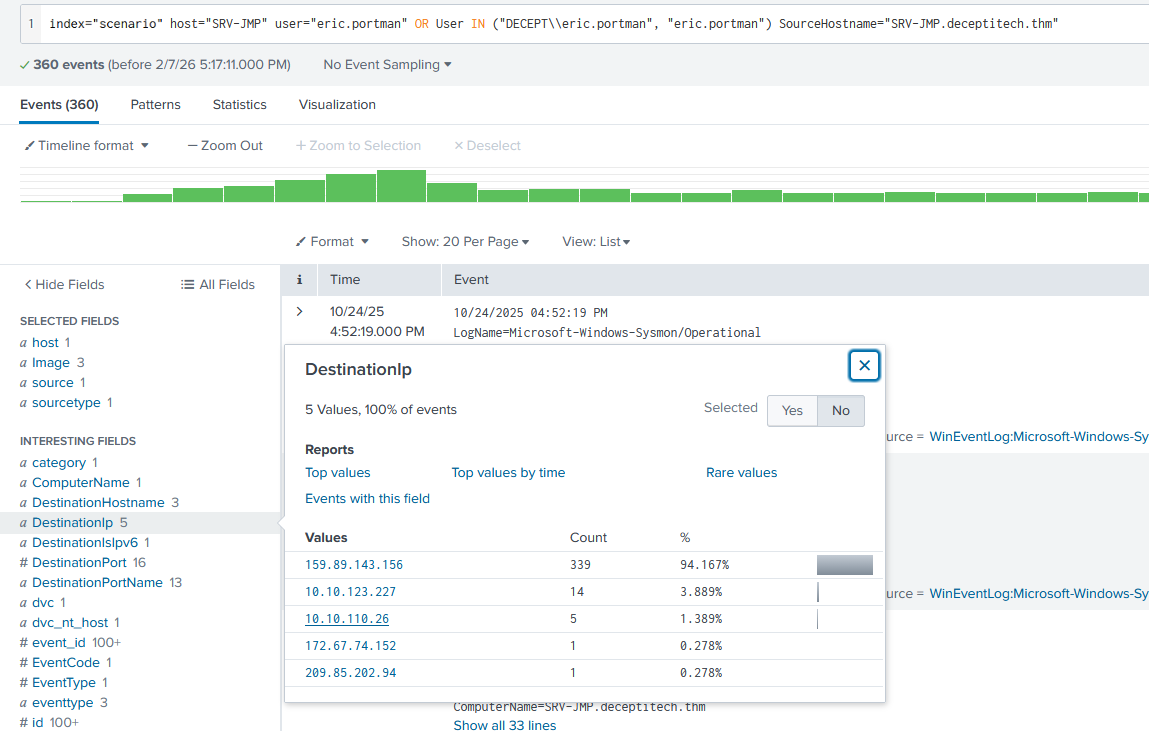
After a very clear graphical overview, I swtiched back to Events view.
Finally, after having added SRV-ITFS’s IP to the query, I extracted the exact list of scanned ports using stats.
Query #3:
index="scenario" host="SRV-JMP" user="eric.portman" OR User IN ("DECEPT\\eric.portman", "eric.portman") SourceHostname="SRV-JMP.deceptitech.thm" DestinationIp="10.10.110.26"
| stats values(DestinationPort)

Answer: 135, 139, 445, 3389, 5985
Insights: Spikes in port activity can indicate reconnaissance behavior. These ports correspond to common Windows services used for file sharing and remote administration, which are typically targeted during lateral movement.
Process:
While analyzing earlier command-line activity, I recalled seeing references to SRV-ITFS, which suggested internal reconnaissance activity. To investigate this further, I created a query to extract all command-line executions referencing this host.
Query:
index="scenario" CommandLine=*SRV-ITFS*
| table _time CommandLine
| sort -_time
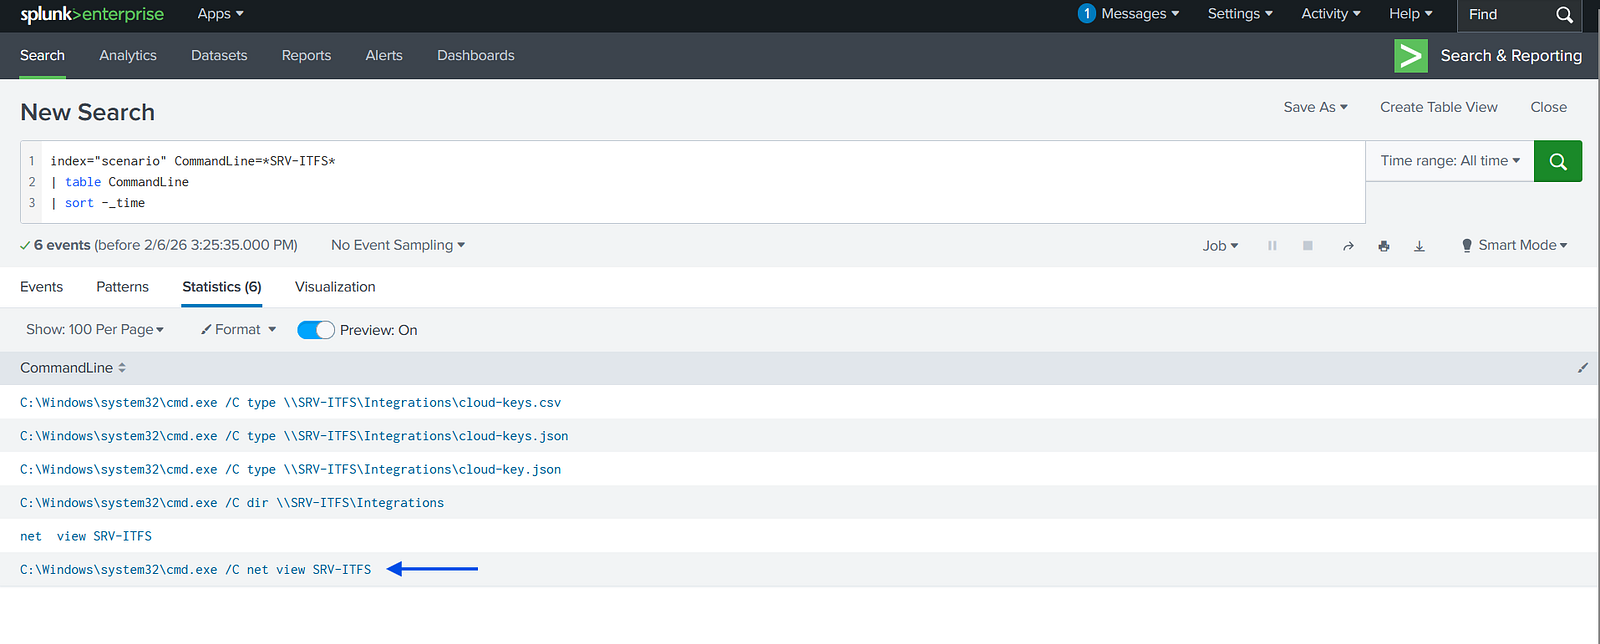
Reviewing the results, I identified a command using:
net view SRV-ITFS
This command is commonly used to enumerate shared resources on a remote system, which strongly indicates discovery activity.
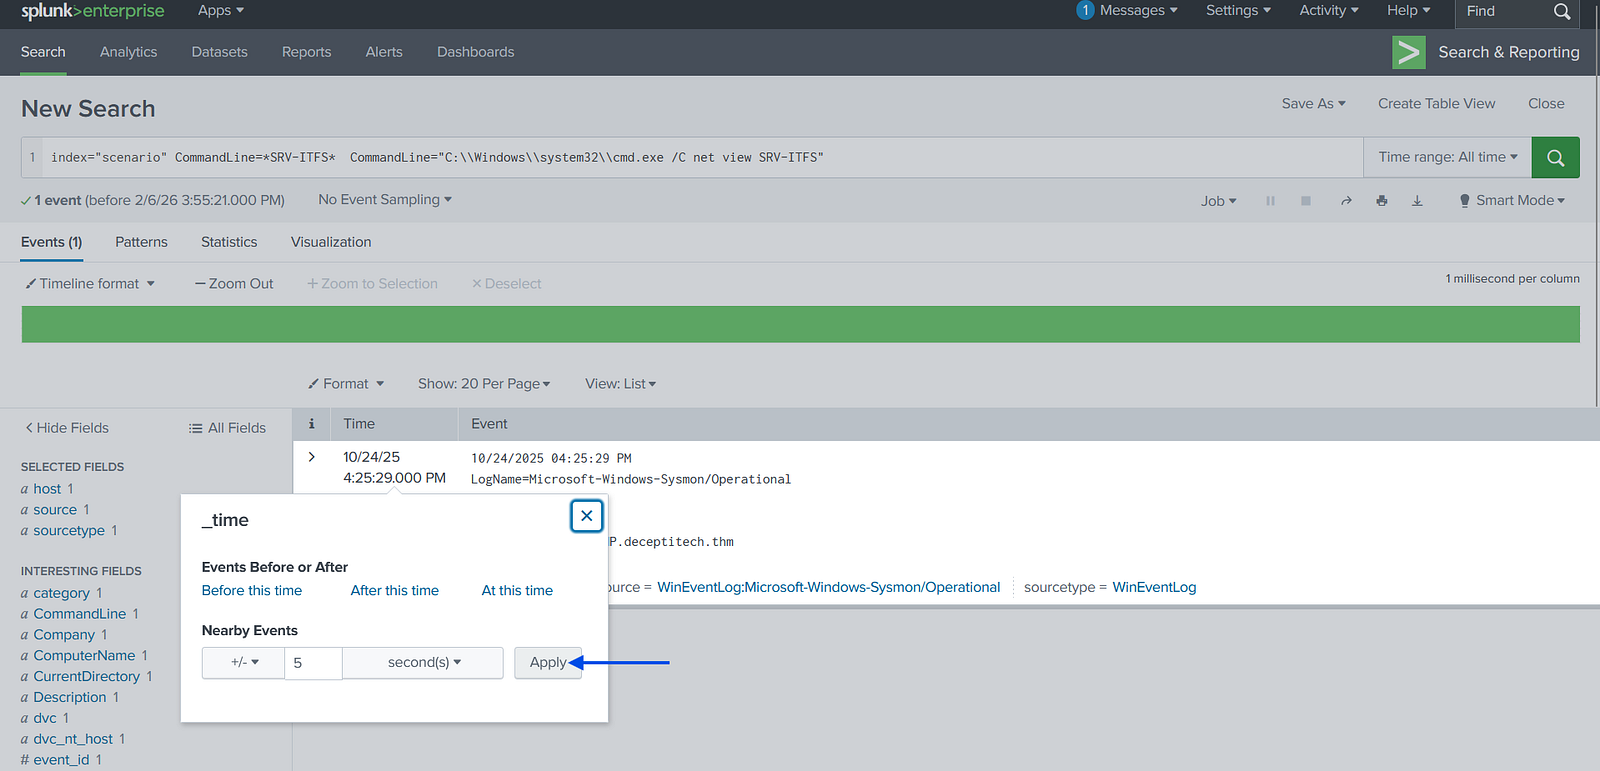
To understand what triggered this command, I pivoted into the event context by examining surrounding logs. Using Splunk’s “Show Nearby Events” feature (±5 seconds), I was able to identify the parent process responsible for executing this command.
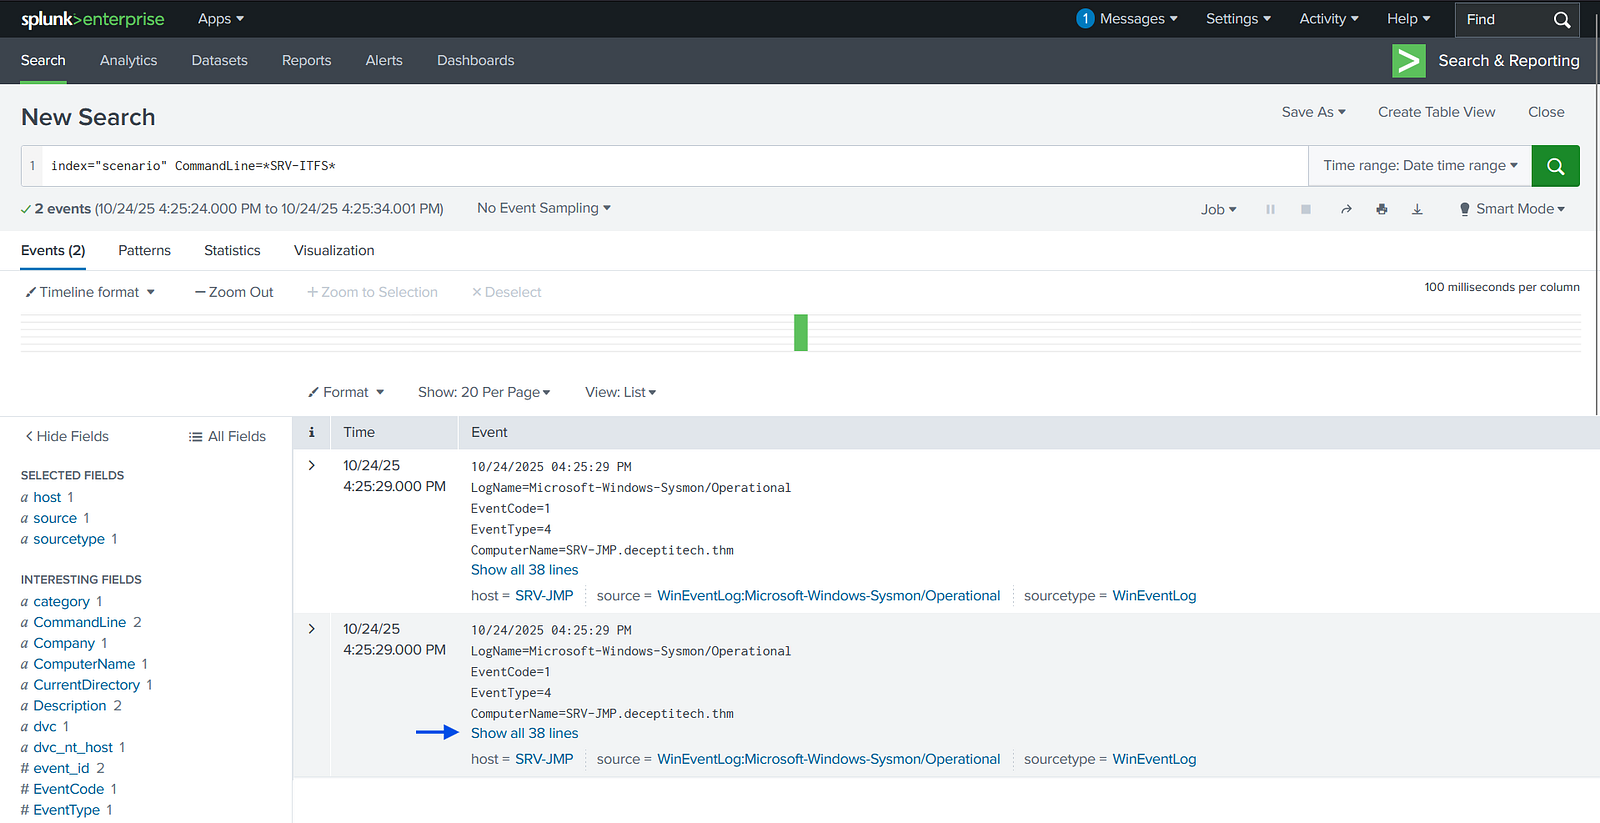
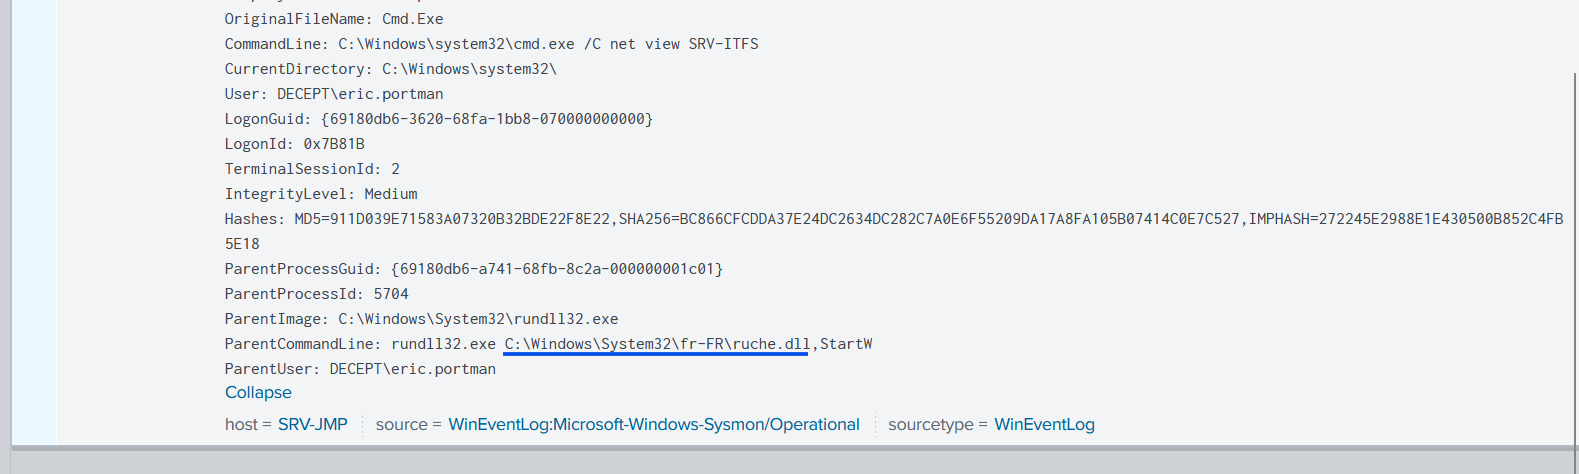
From these correlated events, I identified the malware responsible for the discovery activity.
Answer: C:\Windows\System32\fr-FR\ruche.dll
Insights:
net view confirms network share enumeration, part of the Discovery phaseProcess:
To identify persistence mechanisms on the beachhead host, I searched for usage of schtasks, a legitimate Windows utility frequently abused for persistence.
Query:
index="scenario" schtasks
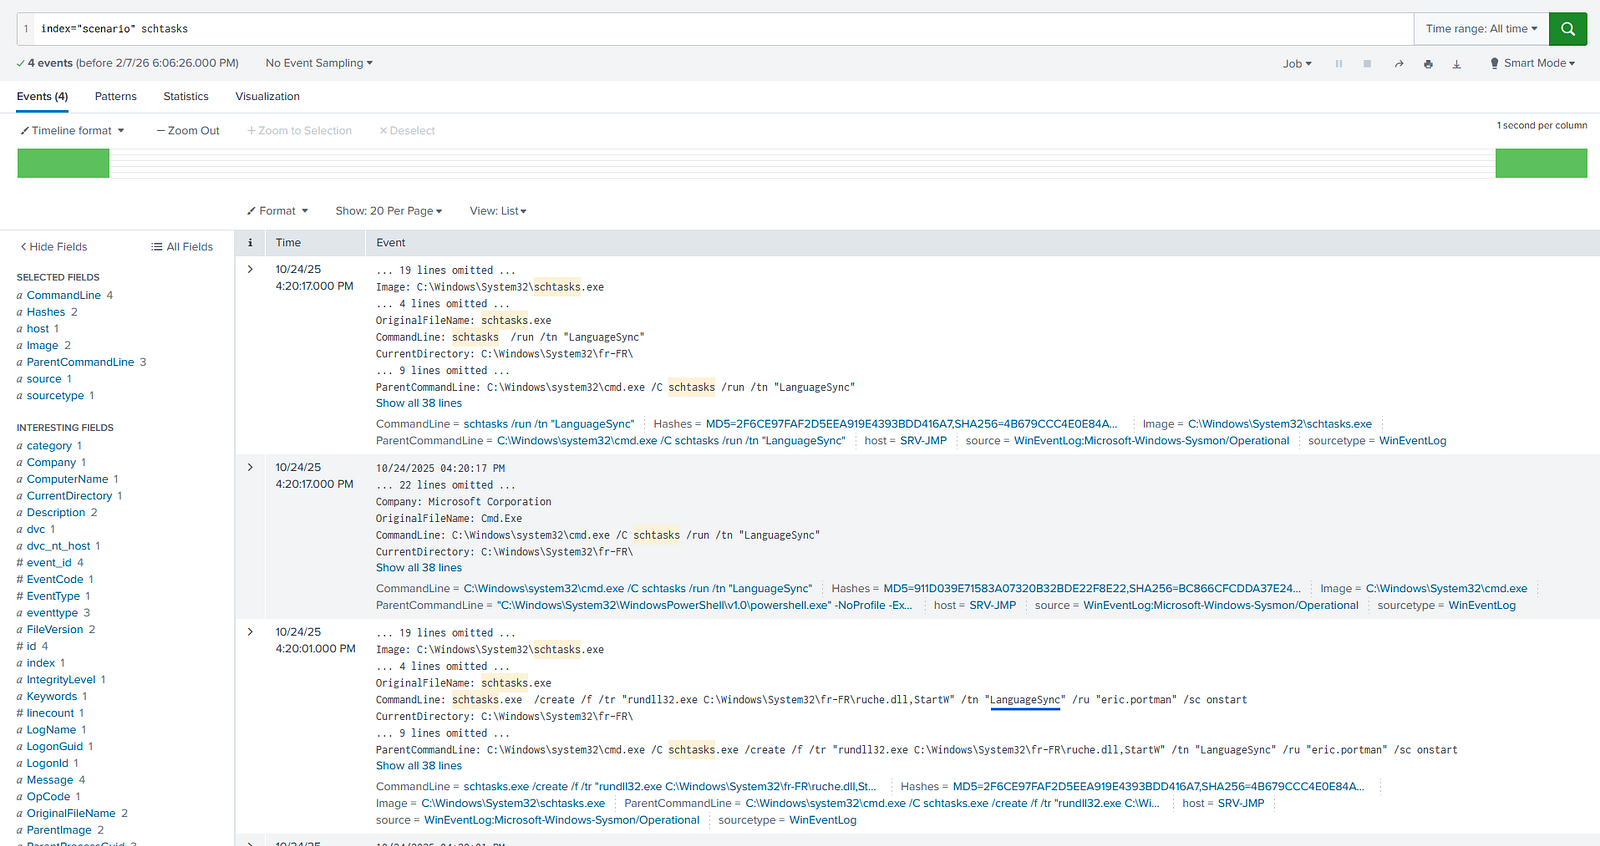
This returned several events. By reviewing them, I identified one directly associated with the previously discovered malware (ruche.dll), indicating the creation of a scheduled task.
Inspecting the command details revealed the name of the created task.
Answer: LanguageSync
Insights:
Process:
To trace the origin of malicious outbound activity, I searched for network connections originating from the beachhead host.
Query #1:
index="secenario" SourceHostname=SRV-JMP.deceptitech.thm EventCode=3
| table _time DestinationHostname DestinationIP DestinationPort DestinationPortName
| sort _time
This revealed early connections to the external IP 159.89.143.156 over port 8080, which appeared suspicious.
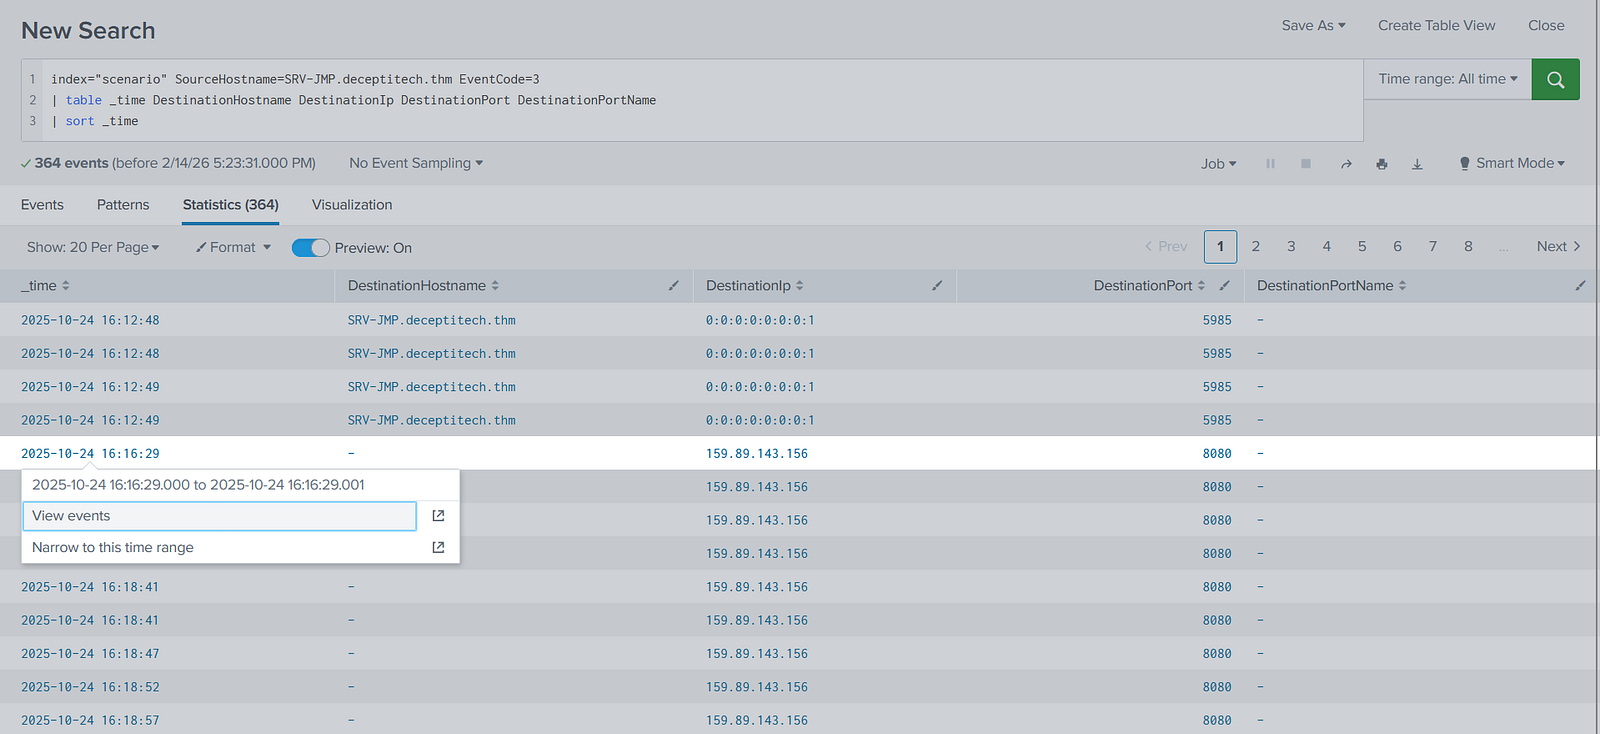
To determine what triggered these connections, I pivoted to events immediately preceding them by selecting the first occurrence and reviewing earlier logs.
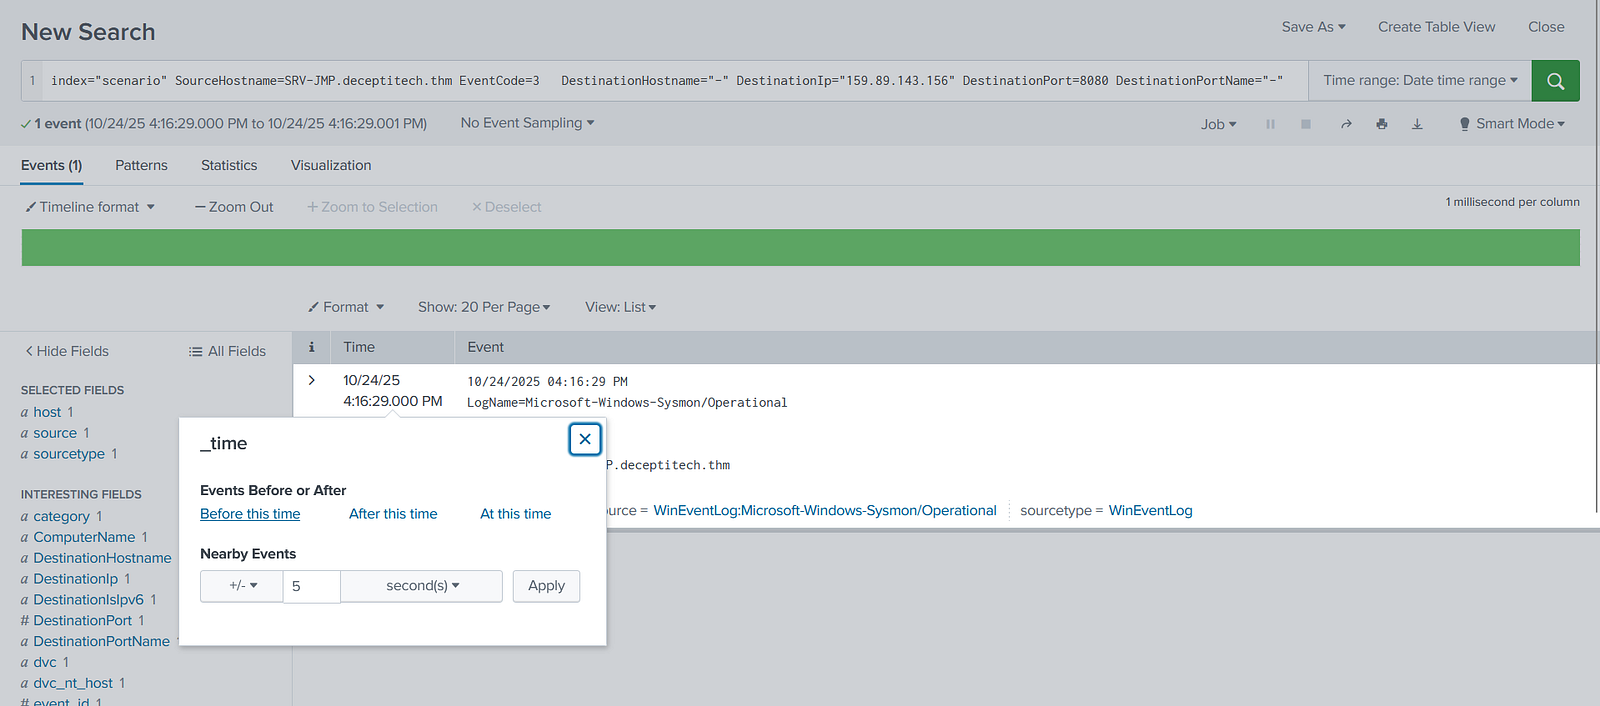
This led to the discovery of a large PowerShell script block, fragmented across multiple events.
To reconstruct it, I queried specifically for PowerShell Script Block Logging (EventCode 4104):
Query #2:
index="secenario" ComputerName=SRV-JMP.deceptitech.thm EventCode=4104
| table _time Message
| sort -_time
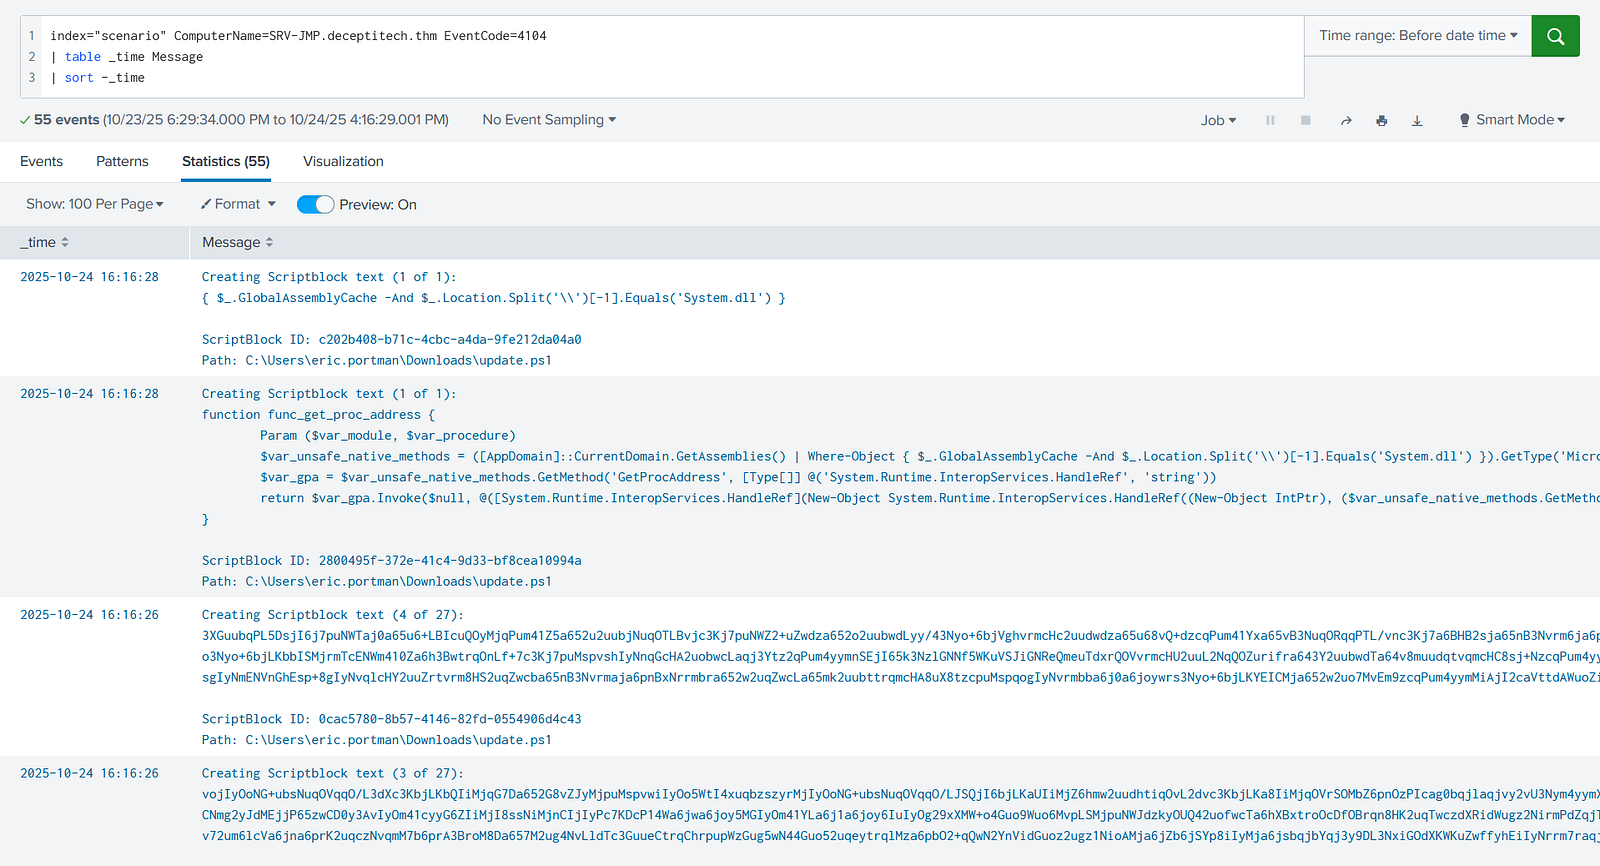
I then:
Finally, I generated the MD5 hash of the decoded shellcode.
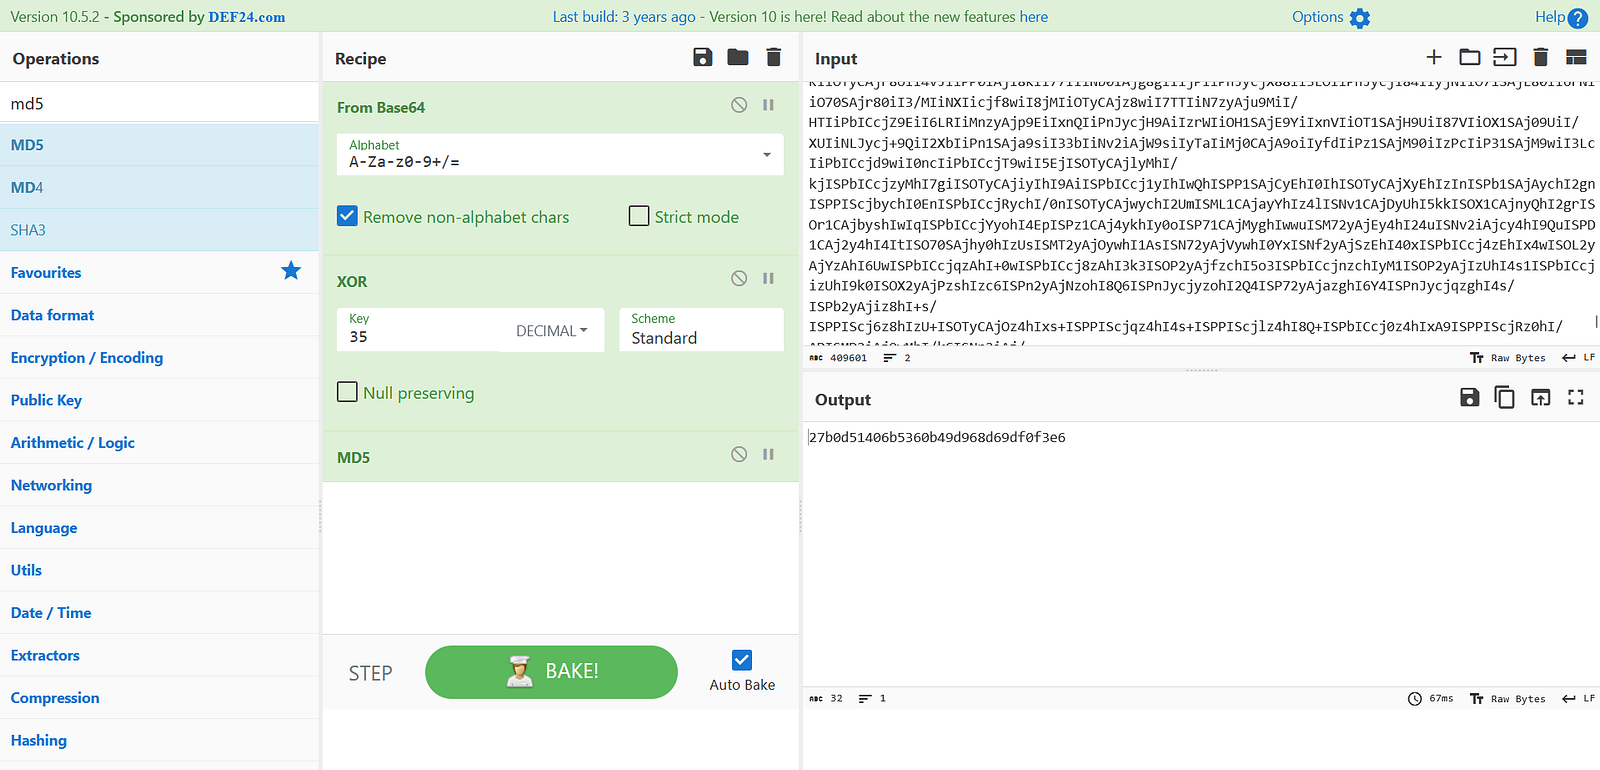
Answer: 27B0D51406B5360B49D968D69DF0F3E6
Insights:
Process:
To identify command-and-control patterns, I analyzed the most frequent network connections and associated processes.
Query:
index="scenario"
| top SourceHostname DestinationHostname DestinationIp DestinationPort Image
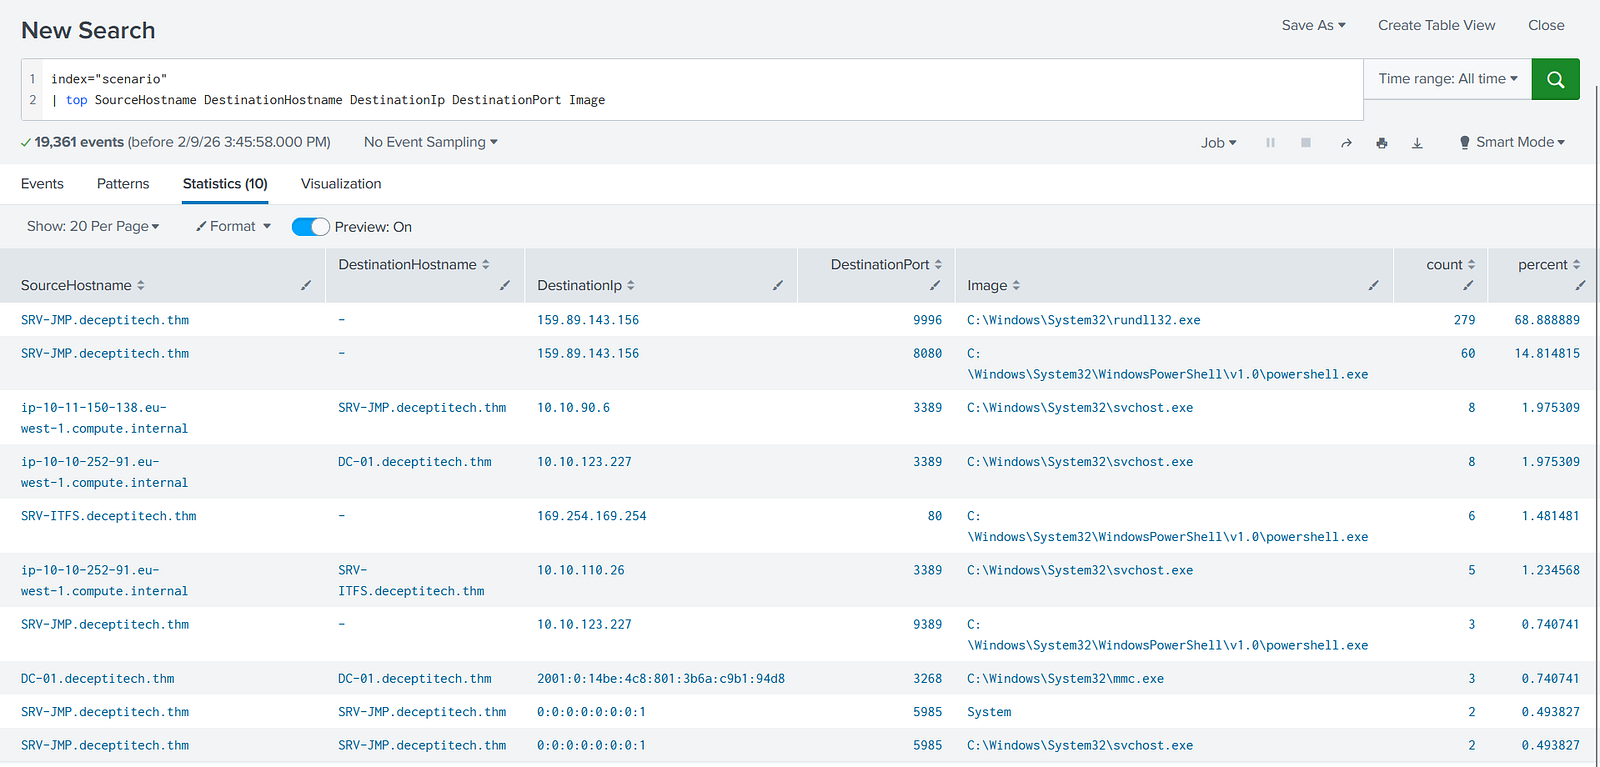
The results showed:
SRV-JMP to 159.89.143.1568080 via powershell.exe9996 via rundll32.exeThese patterns suggested structured beaconing behavior.
To validate this, I performed external research using the observed indicators:

This matched known characteristics of a specific C2 framework.

Answer: Cobalt Strike
Insights:
rundll32, powershell)Process:
To identify the source of lateral movement, I analyzed successful authentication events on the beachhead host.
Query:
index=scenario ComputerName=SRV-JMP.deceptitech.thm EventCode=4624 (Logon_Type=3 OR Logon_Type=10)
This filters:
Reviewing the results, I identified a single source host responsible for multiple successful logins.
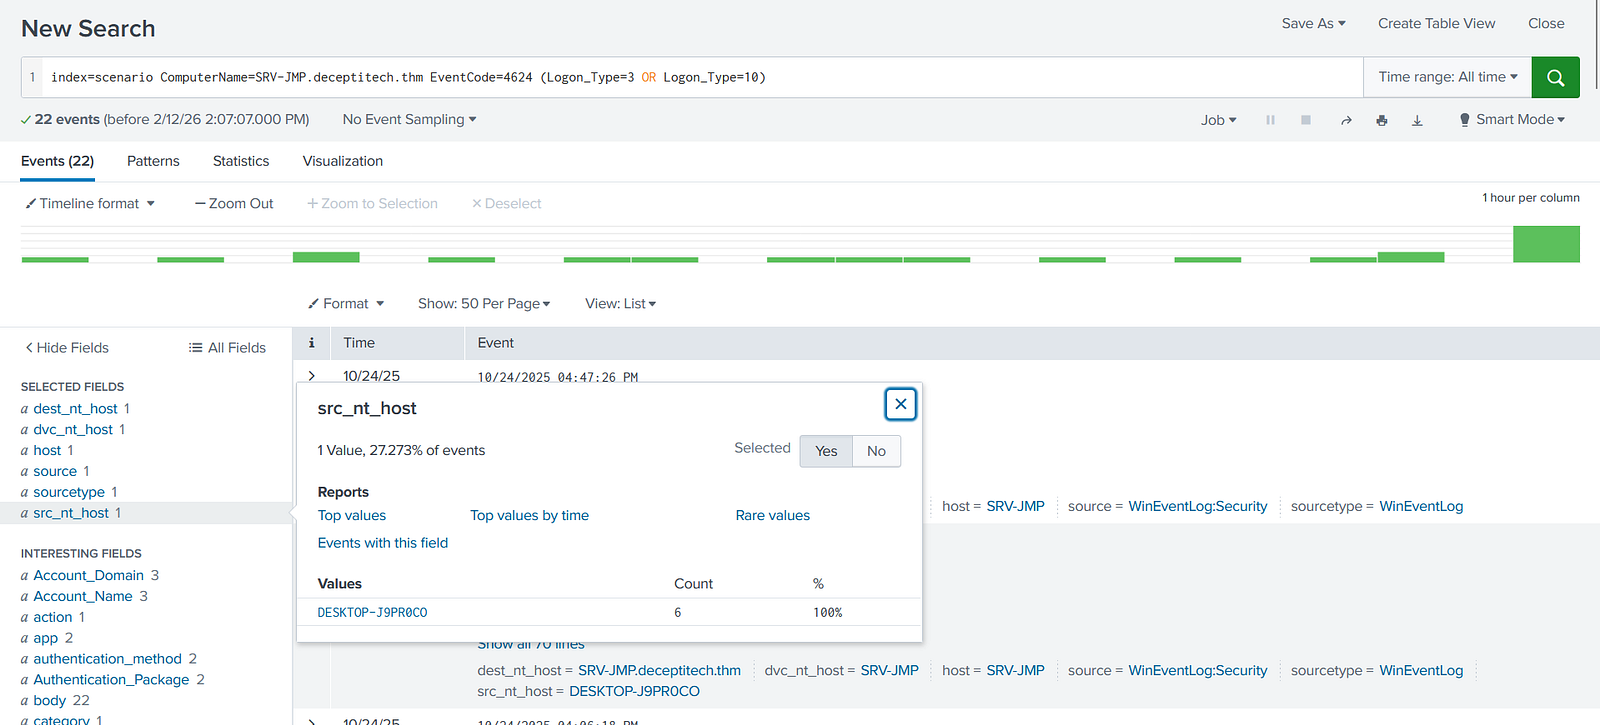
Answer: DESKTOP-J9PR0CO
Insights:
Process:
To continue tracking ruche.dll activity, I searched for its command-line usage.
Query:
index=scenario ruche.dll
| table _time CommandLine
| sort -_time
In the results, I found commands using type to read files from a network share, specifically targeting .csv and .json files.
The naming of the file strongly suggested it contained cloud credentials.
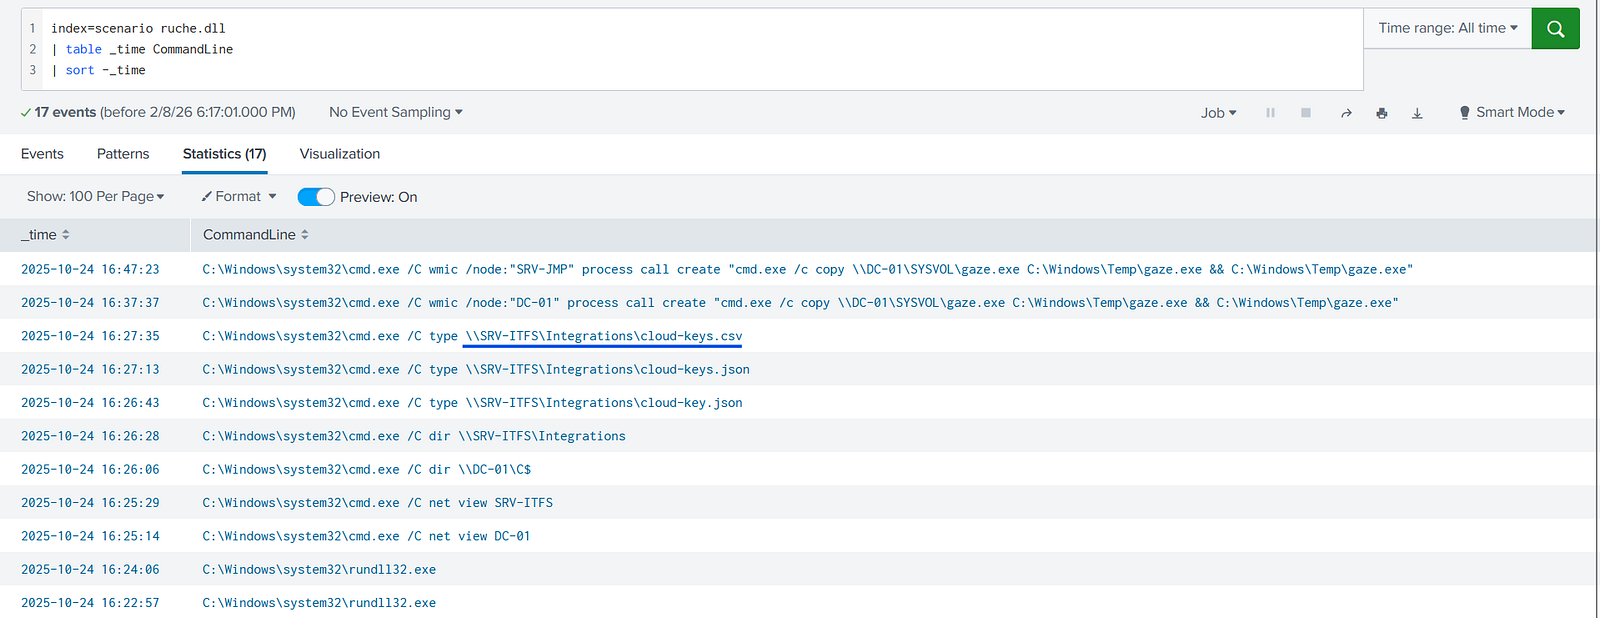
Answer: \\SRV-ITFS\Integrations\cloud-keys.csv
Insights:
Process:
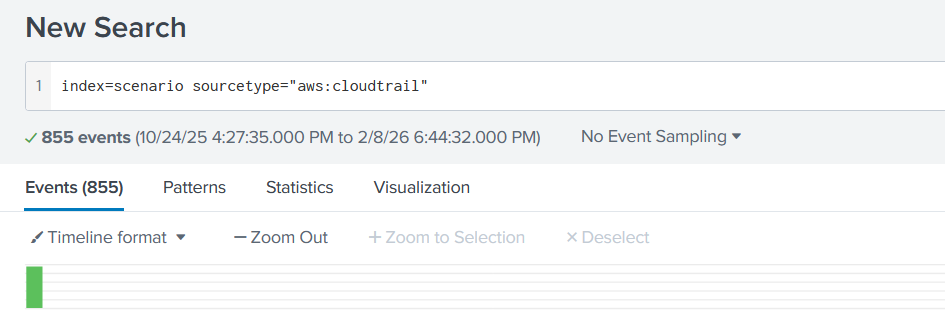
To investigate cloud activity, I filtered for AWS CloudTrail logs.
Query #1:
index=scenario sourcetype="aws:cloudtrail"
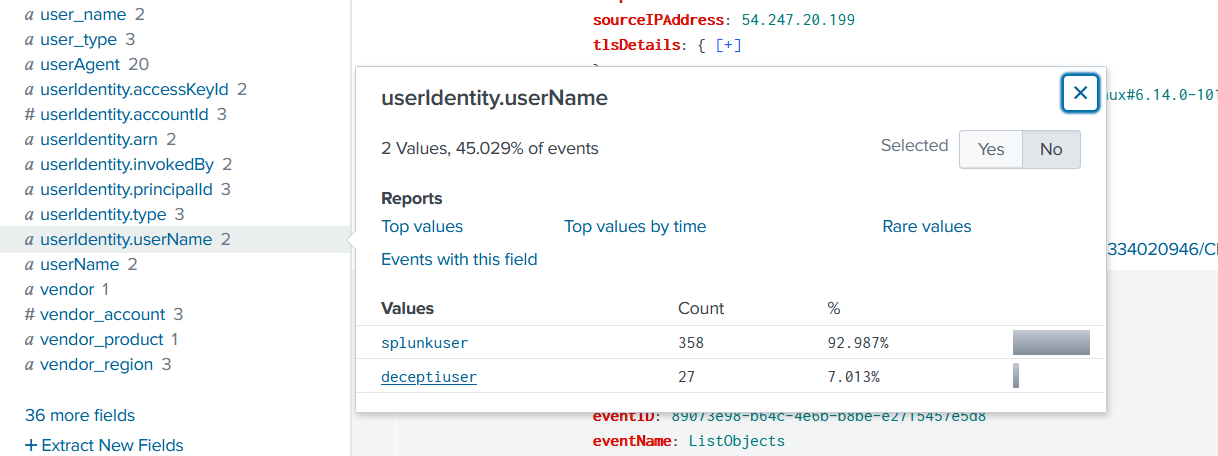
Next, I searched for suspicious user activity by inspecting the userIdentity.userName field.
I identified a potentially malicious user: deceptiuser.
After filtering for this user, I examined the sourceIPAddress field.
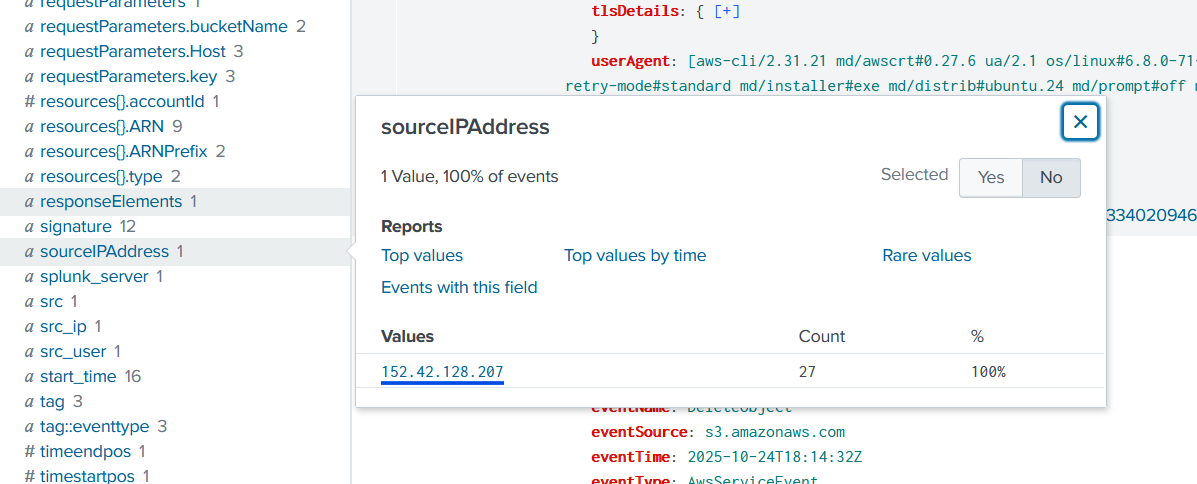
Answer: 152.42.128.207
Insights:
Process:
To identify exfiltration, I searched for GetObject operations from the malicious IP.
Query:
index="scenario" sourcetype="aws:cloudtrail" 152.42.128.207 eventName=GetObject requestParameters.key=*
| table _time requestParameters.key
This returned file access events from S3.
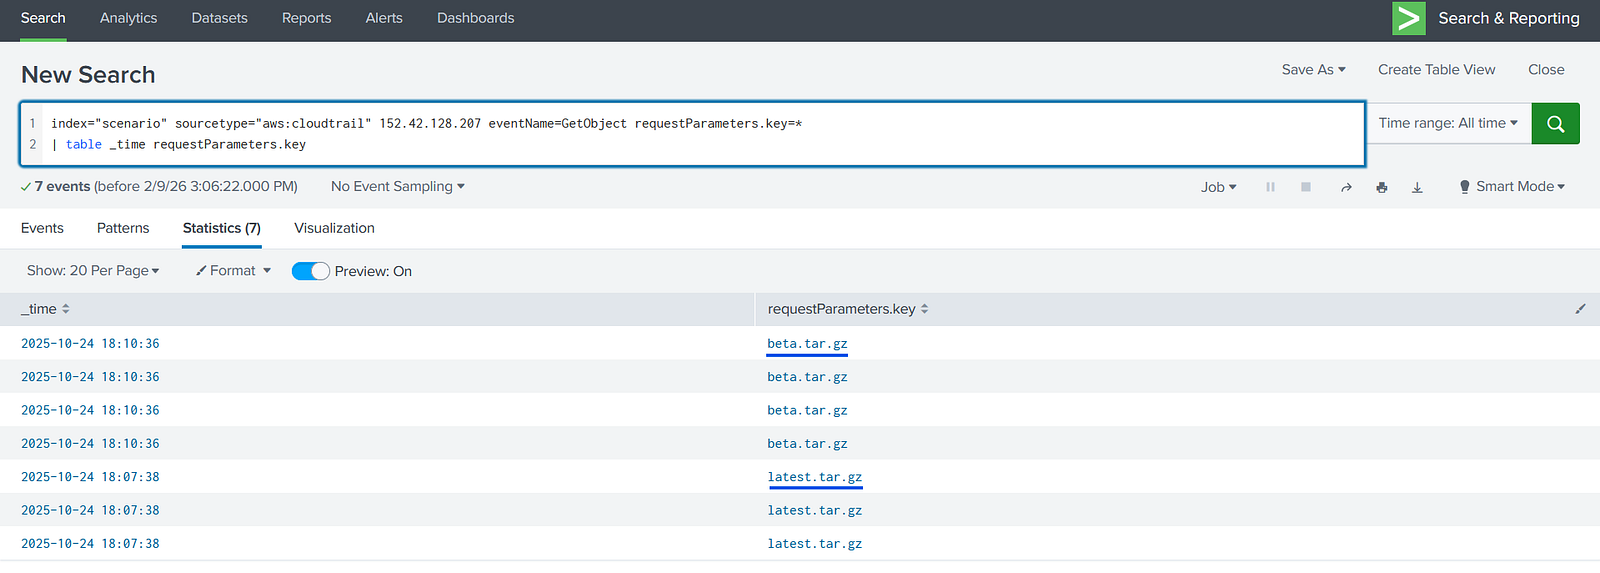
Answer: beta.tar.gz, latest.tar.gz
Insights:
GetObject indicates data retrieval from S3Process:
To identify attacker modifications, I searched for PutObject operations.
Query:
index="scenario" sourcetype="aws:cloudtrail" 152.42.128.207 eventName=PutObject requestParameters.key=*
| table _time requestParameters.key
This revealed a file uploaded after the exfiltration activity.
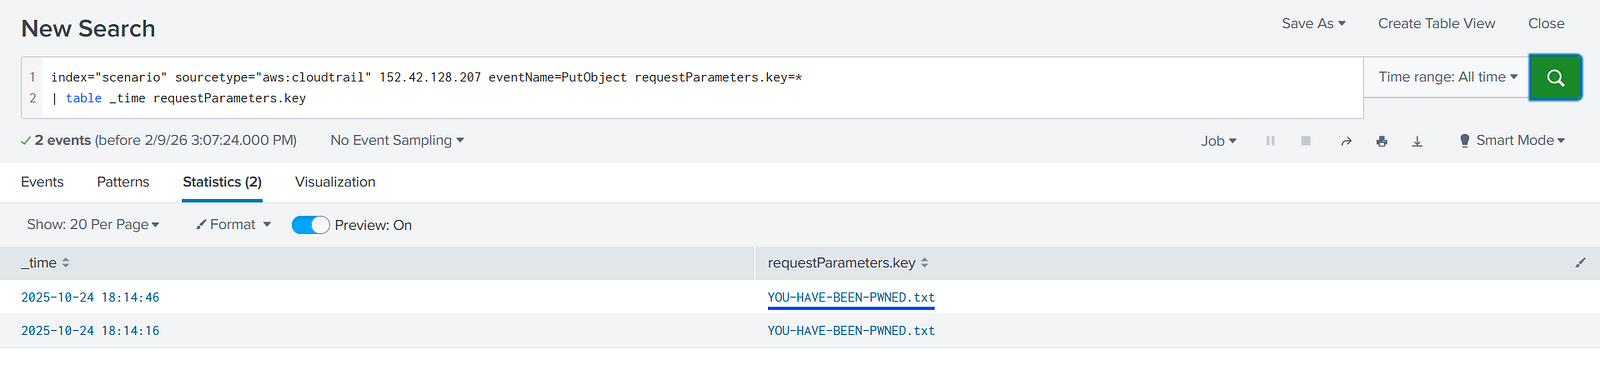
Answer: YOU-HAVE-BEEN-PWNED.txt
Insights:
PutObject indicates file upload or overwrite in S3This investigation demonstrates practical SOC analyst capabilities:
Task 8 highlights how modern ransomware incidents extend beyond endpoint compromise into full-scale enterprise and cloud environments.
By correlating telemetry across multiple data sources, it is possible to reconstruct the attacker’s actions — from initial deployment to persistence, lateral movement, command-and-control, and ultimately data exfiltration.
This type of investigation reflects the real-world responsibilities of a SOC analyst, where visibility, structured analysis, and contextual understanding are essential for effective detection and response.
A detection-engineering exercise using Sigma, Splunk, Windows telemetry, and Atomic Red Team to validate vendor-neutral detection logic
How to Validate PowerShell Detections in Splunk with Sysmon, Atomic Red Team, and MITRE ATT&CK
Exploring the new skills, technologies and investigative mindset behind TryHackMe's updated L2 curriculum