

From Splunk to Sigma: Building and Validating Vendor-Neutral Detection Logic
A detection-engineering exercise using Sigma, Splunk, Windows telemetry, and Atomic Red Team to validate vendor-neutral detection logic


One of the most effective ways to develop practical SOC analyst skills is to build and operate a realistic lab environment.
While certifications provide theoretical knowledge, a homelab allows you to work directly with operating systems, network services, logging pipelines, endpoint telemetry, SIEM platforms, and troubleshooting scenarios that closely resemble real-world environments.
To strengthen my defensive security skills, I built a small enterprise-style SOC homelab consisting of:
The objective was not simply to deploy these technologies, but to understand how security-relevant events are generated, transported, collected, and analyzed.
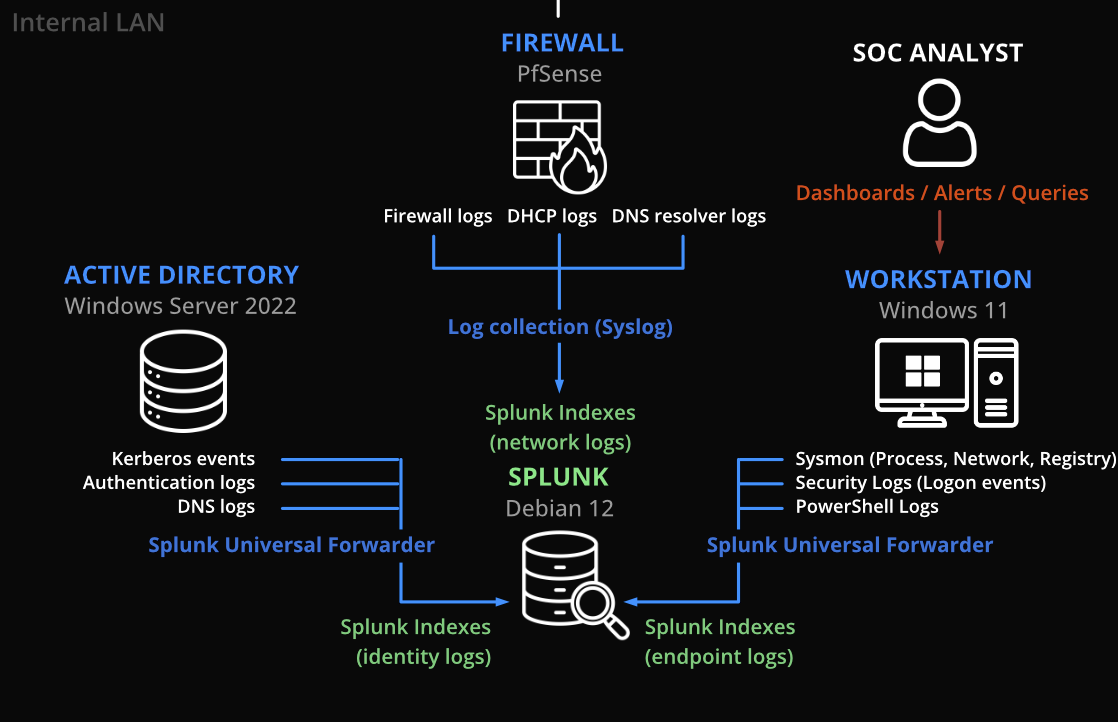
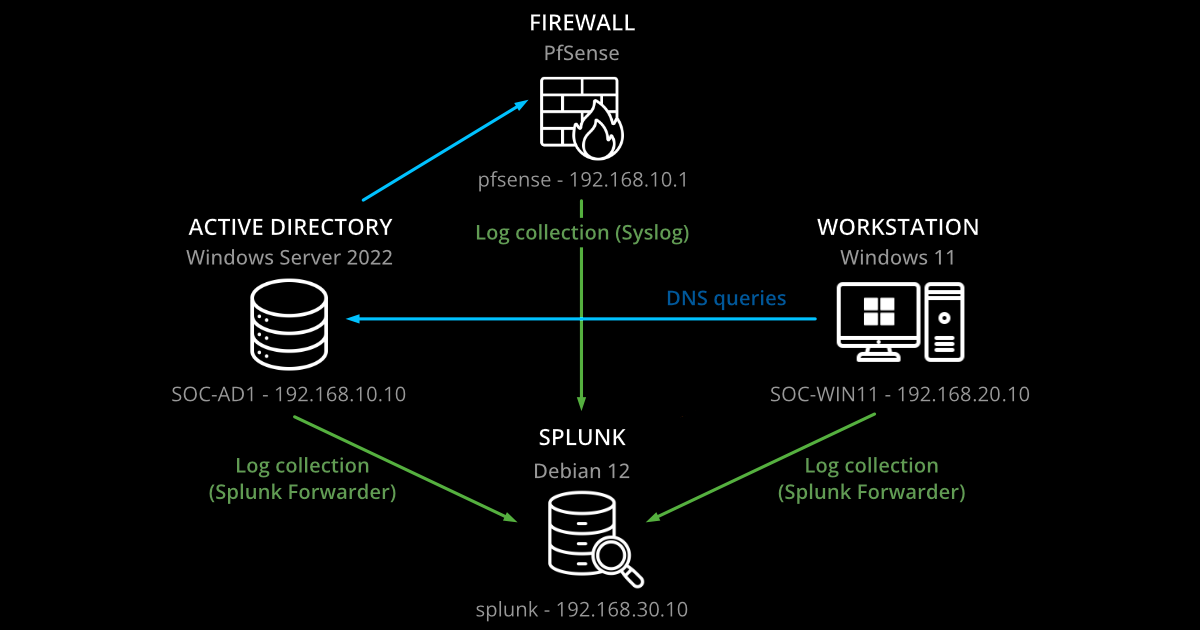
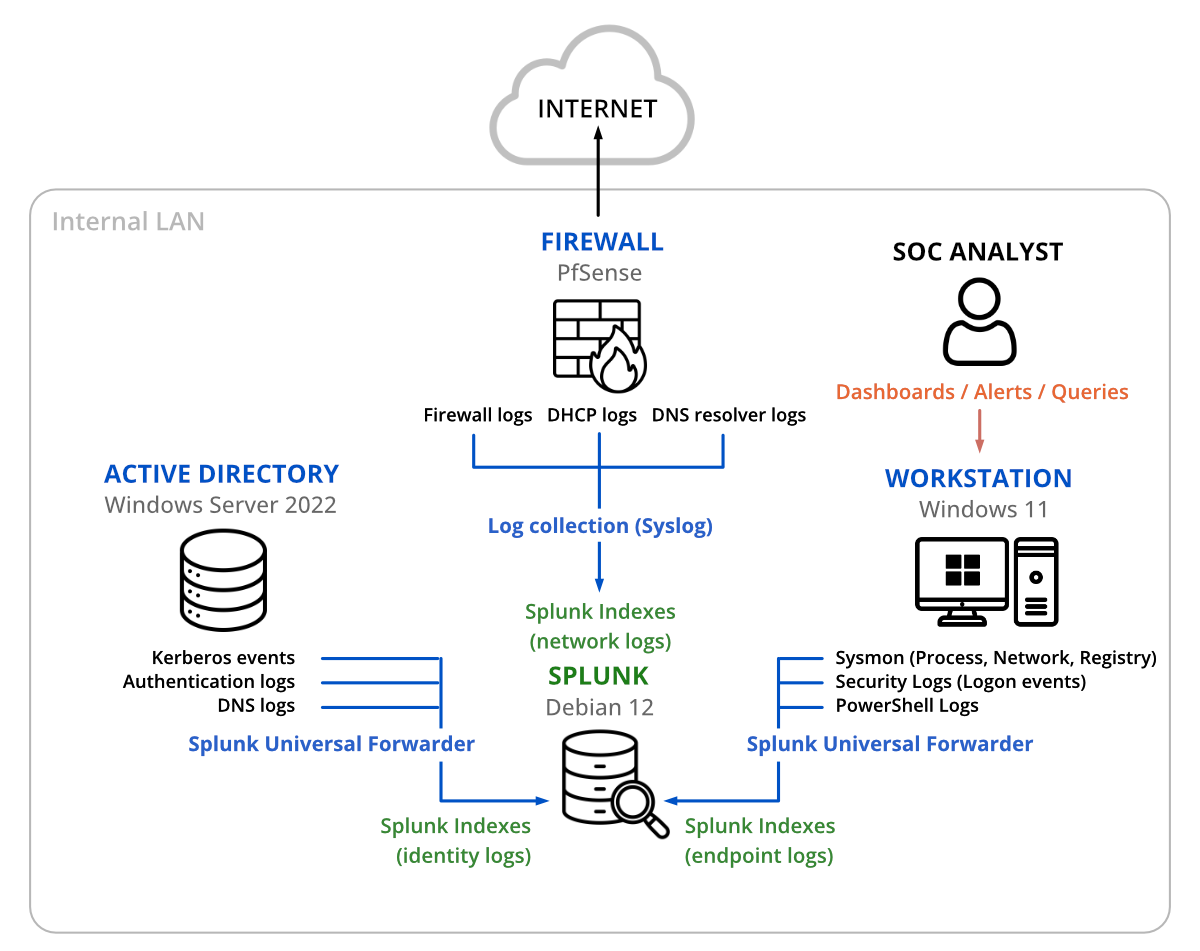
The following diagram shows the final architecture.
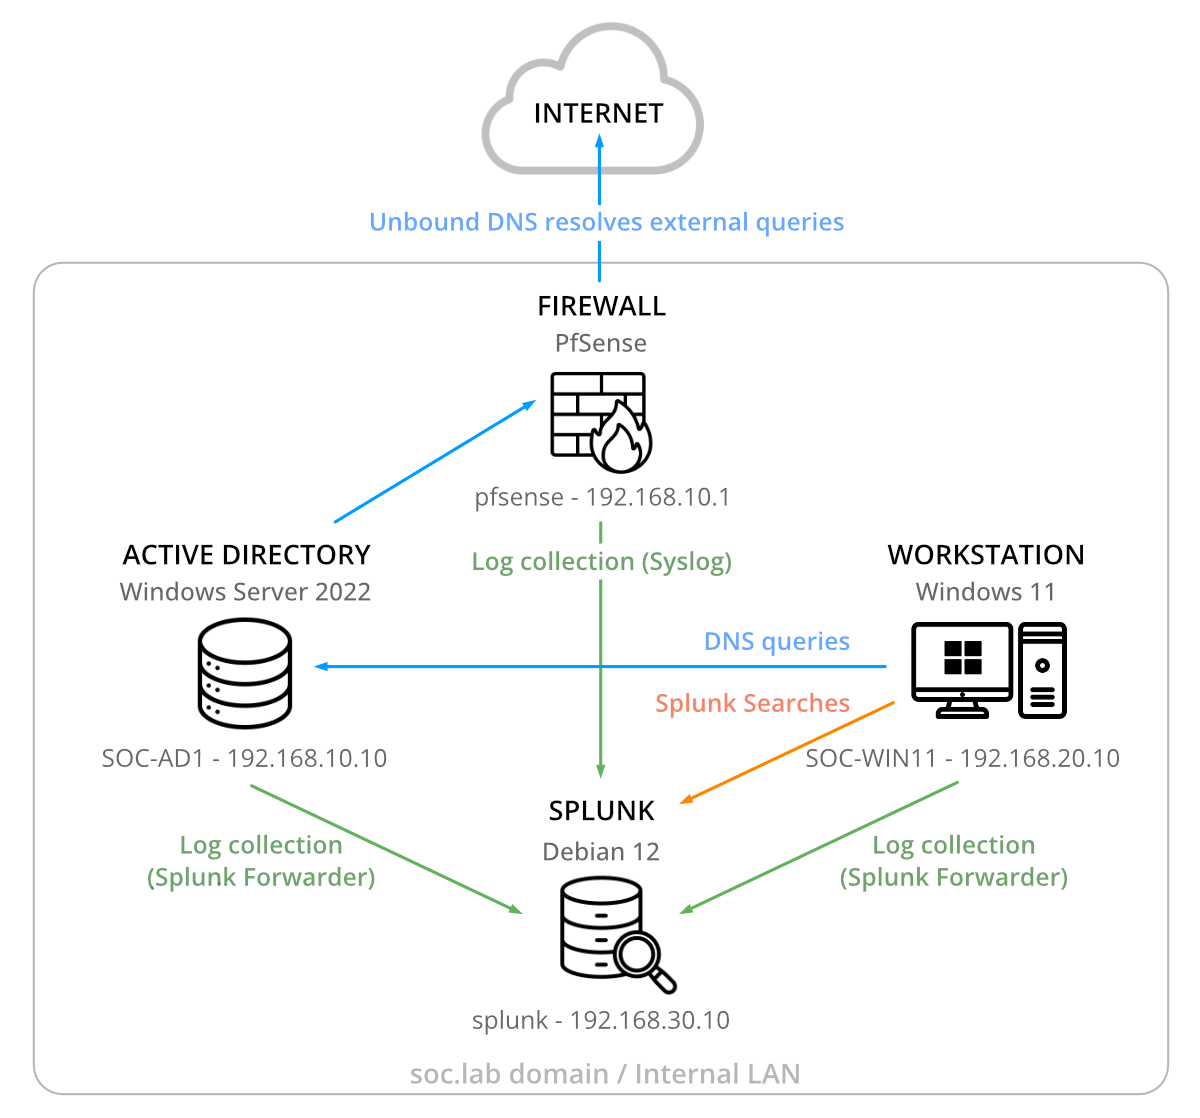
The lab consists of four virtual machines running inside VirtualBox.
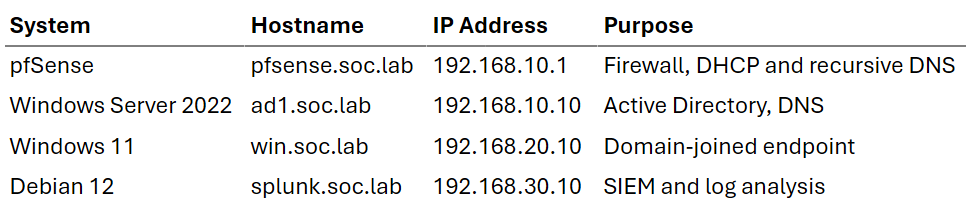
Rather than placing all systems inside a single flat network, I divided the environment into multiple security zones connected through pfSense. This design more closely resembles enterprise environments where infrastructure, user endpoints, and security tooling are separated into dedicated network segments.
The lab uses three internal segments:
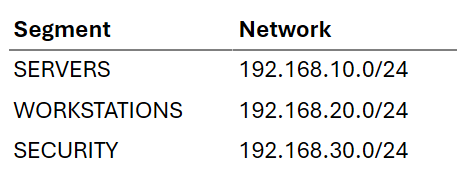
Traffic between these segments is controlled through pfSense firewall rules, allowing only the communications required for authentication, DNS resolution, log forwarding, and administration.
The entire environment runs inside VirtualBox using isolated internal networks.
This approach provides:
Using virtualization also allows rapid rebuilding of systems and experimentation without impacting production devices.
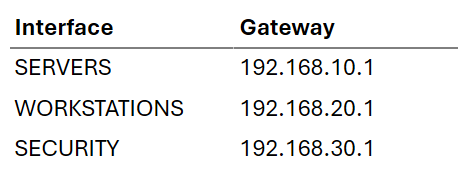
The first component deployed was pfSense, which acts as the security boundary for the environment.
WAN Interface: Internet connectivity
SERVERS Interface: 192.168.10.0/24
WORKSTATIONS Interface: 192.168.20.0/24
SECURITY Interface: 192.168.30.0/24
Rather than allowing clients to perform direct DNS resolution, I implemented a layered DNS architecture:
1. Windows clients send DNS requests to Active Directory.
2. Active Directory resolves internal domain records and forwards unknown queries to pfSense.
3. pfSense uses Unbound as a recursive DNS resolver to resolve external domains.
This design mirrors many enterprise environments where Active Directory serves as the primary DNS authority.
To enforce this architecture, I created firewall rules that restrict communication between network segments while allowing the services required for normal operation.
Examples include:
This approach follows the principle of least privilege while generating valuable network telemetry for security monitoring.
To more closely resemble a real enterprise environment, I separated the lab into multiple security zones using pfSense interfaces and firewall policies.
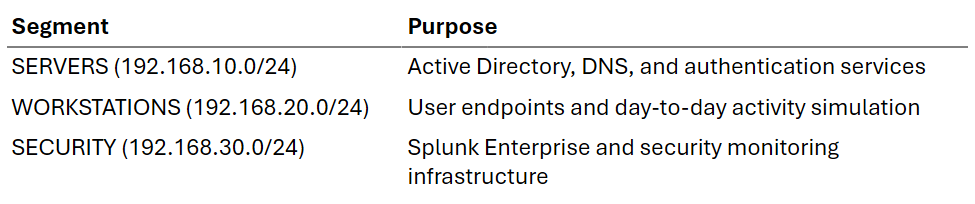
Rather than allowing unrestricted communication between networks, access is controlled through explicit firewall rules based on business requirements.
Examples include:
After implementing segmentation, I validated the configuration by testing both allowed and denied communications. SMB traffic required for domain functionality was successfully permitted, while unauthorized services such as RDP were blocked. These denied connections generate firewall telemetry that can be forwarded to Splunk and used during investigation and detection engineering exercises.
pfSense forwards the following logs to Splunk via Syslog:
This provides valuable network-level visibility alongside endpoint telemetry.
The next component deployed was a Windows Server 2022 domain controller.
IP Address: 192.168.10.10
Gateway: 192.168.10.1
DNS: 192.168.10.10
The server hosts:
The DNS server was configured to forward unresolved requests to pfSense.
This allows the domain controller to remain authoritative for internal records while maintaining internet name resolution.
To generate realistic directory activity, I used the BadBlood PowerShell project to create:
This creates a more realistic environment for security monitoring and investigation exercises than an empty domain.
To improve security visibility, I enabled advanced Windows auditing for key authentication and directory events.
Examples include:
These logs generate valuable telemetry for detecting authentication anomalies and account misuse.
Sysmon was installed using Olaf Hartong’s modular configuration.
This significantly expands endpoint visibility beyond native Windows logging by capturing:
To simulate a standard enterprise endpoint, I deployed a Windows 11 Pro workstation and joined it to the Active Directory domain.
IP Address: 192.168.20.10
Gateway: 192.168.20.1
DNS: 192.168.10.10
The workstation was configured with:
This endpoint generates realistic user activity that can be monitored and investigated through Splunk.
Examples include:
The final component deployed was a dedicated Debian 12 server running Splunk Enterprise.
IP Address: 192.168.30.10
Gateway: 192.168.30.1
DNS: 192.168.10.10
I chose Debian because it provides:
To minimize resource usage, I installed a headless version without a graphical interface.
Splunk receives telemetry from multiple sources:
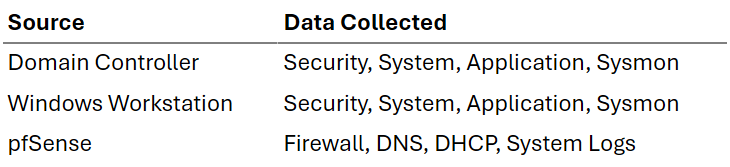
The resulting telemetry pipeline is:
Endpoint Activity → Windows Logs / Sysmon → Splunk Forwarders → Splunk
Network Activity → pfSense Syslog → Splunk
This creates a centralized platform for searching, correlating, and investigating security events.
Collecting logs is one of the most important aspects of any SOC environment. To centralize telemetry from the Windows systems, I deployed Splunk Universal Forwarders on both the Active Directory server and the Windows 11 workstation.
The forwarders were configured to send security-relevant event data to the Splunk Enterprise instance running on the Debian server.
The following Windows Event Log channels were configured for collection:
To achieve this, I configured the appropriate inputs through the inputs.conf file on each endpoint.
Each log source contributes a different perspective during investigations:
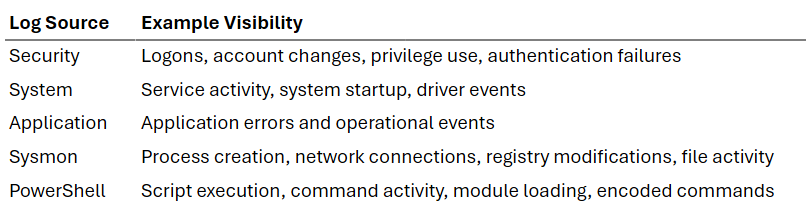
While native Windows logs provide valuable information, Sysmon significantly expands endpoint visibility and enables more detailed investigations and detections.
The resulting data flow is straightforward:
Windows Endpoint → Splunk Universal Forwarder → Splunk Enterprise
This architecture ensures that endpoint activity is centralized within the SIEM, allowing events from multiple systems to be searched, correlated, and investigated from a single location.
Several design decisions were intentionally made to improve visibility and mimic enterprise environments.
Active Directory serves as the authentication authority for all domain resources.
All DNS traffic is forced through Active Directory and pfSense.
Both network and endpoint telemetry are collected.
All logs are aggregated into Splunk for correlation and investigation.
Systems are separated into dedicated network zones for servers, workstations, and security tooling. Communication between segments is restricted through pfSense firewall rules that allow only the services required for business functionality.
This design follows the principle of least privilege and creates opportunities to monitor both allowed and denied traffic. Because firewall events are forwarded to Splunk, the environment can be used to investigate blocked connections, validate access controls, and develop detections based on network policy violations.
BadBlood introduces realistic directory complexity that supports threat hunting and detection exercises.
With the foundation complete, the environment now supports:
Most importantly, it provides hands-on experience troubleshooting the kinds of issues that frequently appear in real enterprise environments.
Building this SOC homelab provided significantly more practical learning than simply studying technologies in isolation.
Beyond deploying the infrastructure itself, the project required understanding how authentication, DNS resolution, endpoint telemetry, logging pipelines, SIEM platforms, network segmentation, and firewall policy design interact within a security monitoring environment.
The completed lab now serves as a foundation for future projects involving detection engineering, threat hunting, attack simulation, and security monitoring workflows.
In the next article, I will cover the challenges encountered during deployment, including log ingestion problems, Sysmon collection issues, DNS troubleshooting, firewall misconfigurations, network segmentation challenges, and time synchronization issues across the environment.
A detection-engineering exercise using Sigma, Splunk, Windows telemetry, and Atomic Red Team to validate vendor-neutral detection logic
How to Validate PowerShell Detections in Splunk with Sysmon, Atomic Red Team, and MITRE ATT&CK
Exploring the new skills, technologies and investigative mindset behind TryHackMe's updated L2 curriculum