


From Splunk to Sigma: Building and Validating Vendor-Neutral Detection Logic
A detection-engineering exercise using Sigma, Splunk, Windows telemetry, and Atomic Red Team to validate vendor-neutral detection logic


While preparing for the Splunk Certified Core User (SPLK-1001) certification, I built a small Splunk homelab to run my own instance and gain hands-on experience with key Splunk concepts.
This article describes my setup process and provides step-by-step practical exercises that can help anyone preparing for the exam or looking to strengthen their foundational Splunk skills.
My lab includes installing and configuring Splunk Enterprise and the Splunk Universal Forwarder, setting up Splunk to receive Windows logs from my workstation, and practicing SPL (Search Processing Language) queries. I also demonstrate how to use the Splunk web interface to create reports and dashboards based on real log data.
These exercises proved instrumental in my own preparation, and I am happy to say I successfully passed the SPLK-1001 exam.
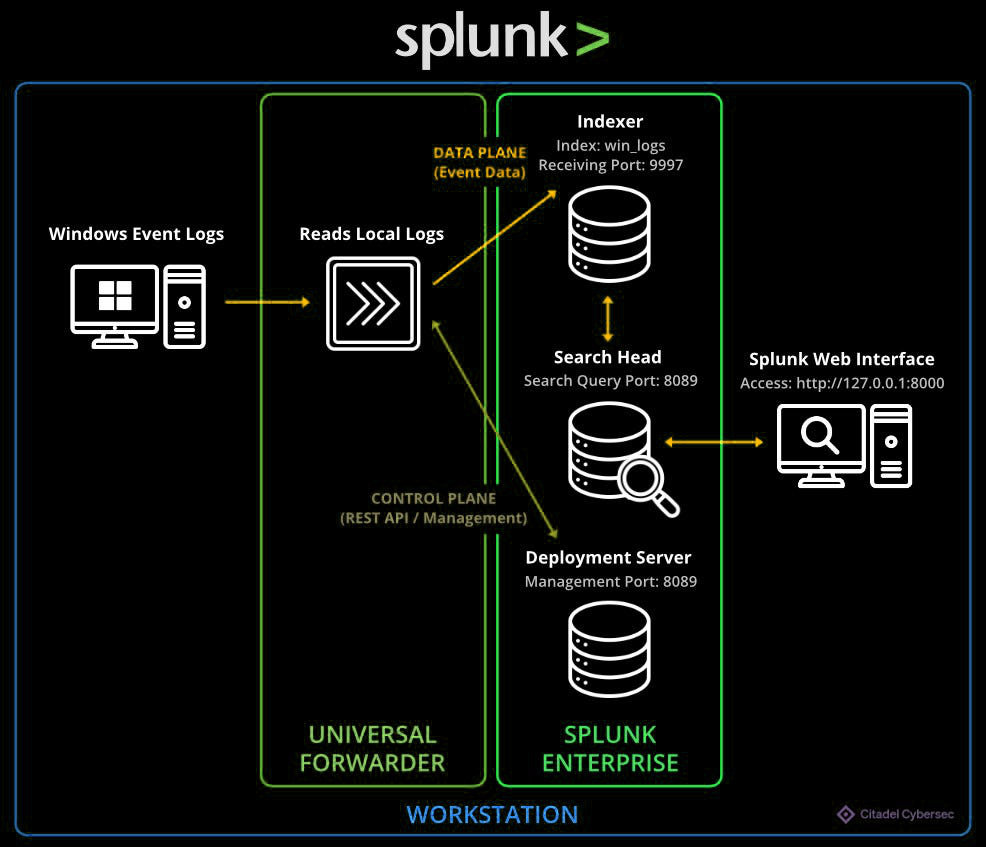
In this section, I present a diagram that summarizes the setup and workflow of my Splunk homelab. This visual representation highlights the key components and how they interact within the environment, giving you a clearer understanding of how everything functions together.
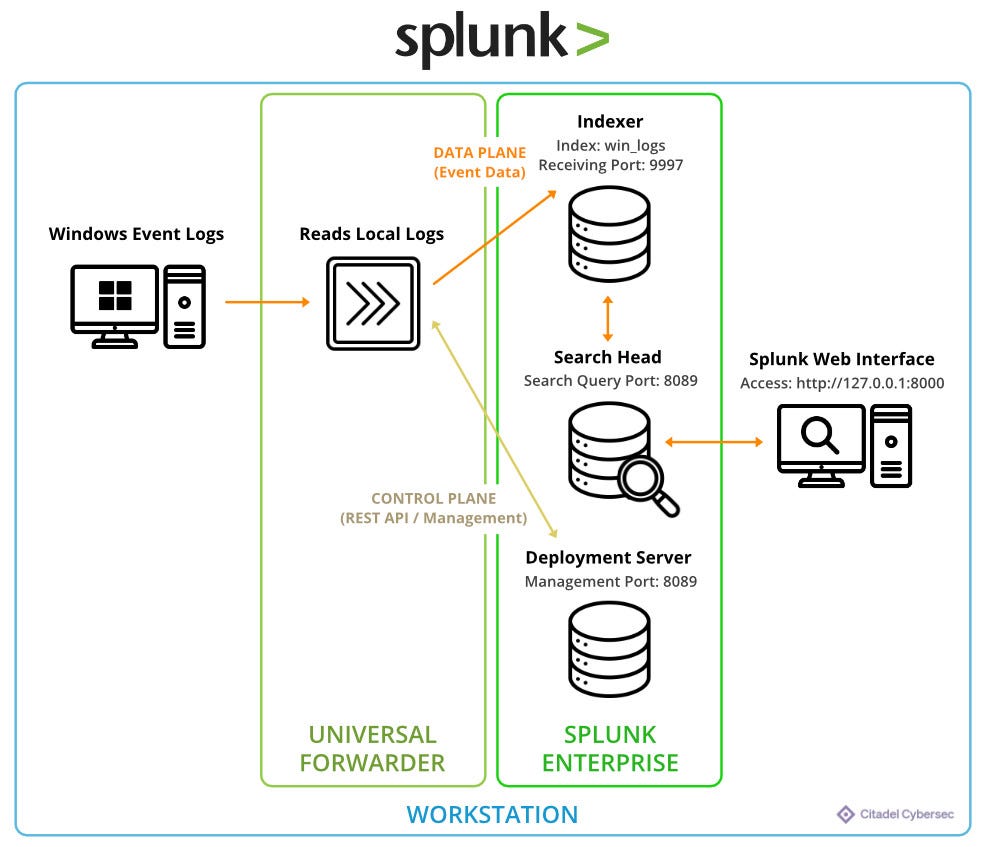
Icon credits: The Chohands Brand, pojok d, Nikita Golubev, Syahrul Ramadhany, Febricon & Royyan Wijaya
| stats count| timechart| table of Recent Failures| top to Identify Failure ReasonsBelow is a concise overview of the tasks performed to get my Splunk instance and Universal Forwarder up and running. Since this post focuses primarily on Splunk usage (interface, SPL commands, reports, and dashboards), I am not going into deep installation detail here.
Settings > Forwarding and Receiving, I selected Configure Receiving and then + Add new.An on-premises Splunk Enterprise instance.127.0.0.1:8089127.0.0.1:9997Settings > Agent Management, my host details became available.Settings > Add Data, I selected Forward data from a Splunk Forwarder.Select Forwarders, I created a New Server Class Name and selected it.Select Source, I chose Local Event Logs and selected:ApplicationSecuritySystemInput Settings, I created a new index called win_logs and selected it.Submit.For step-by-step screenshots and deeper explanations, I recommend:
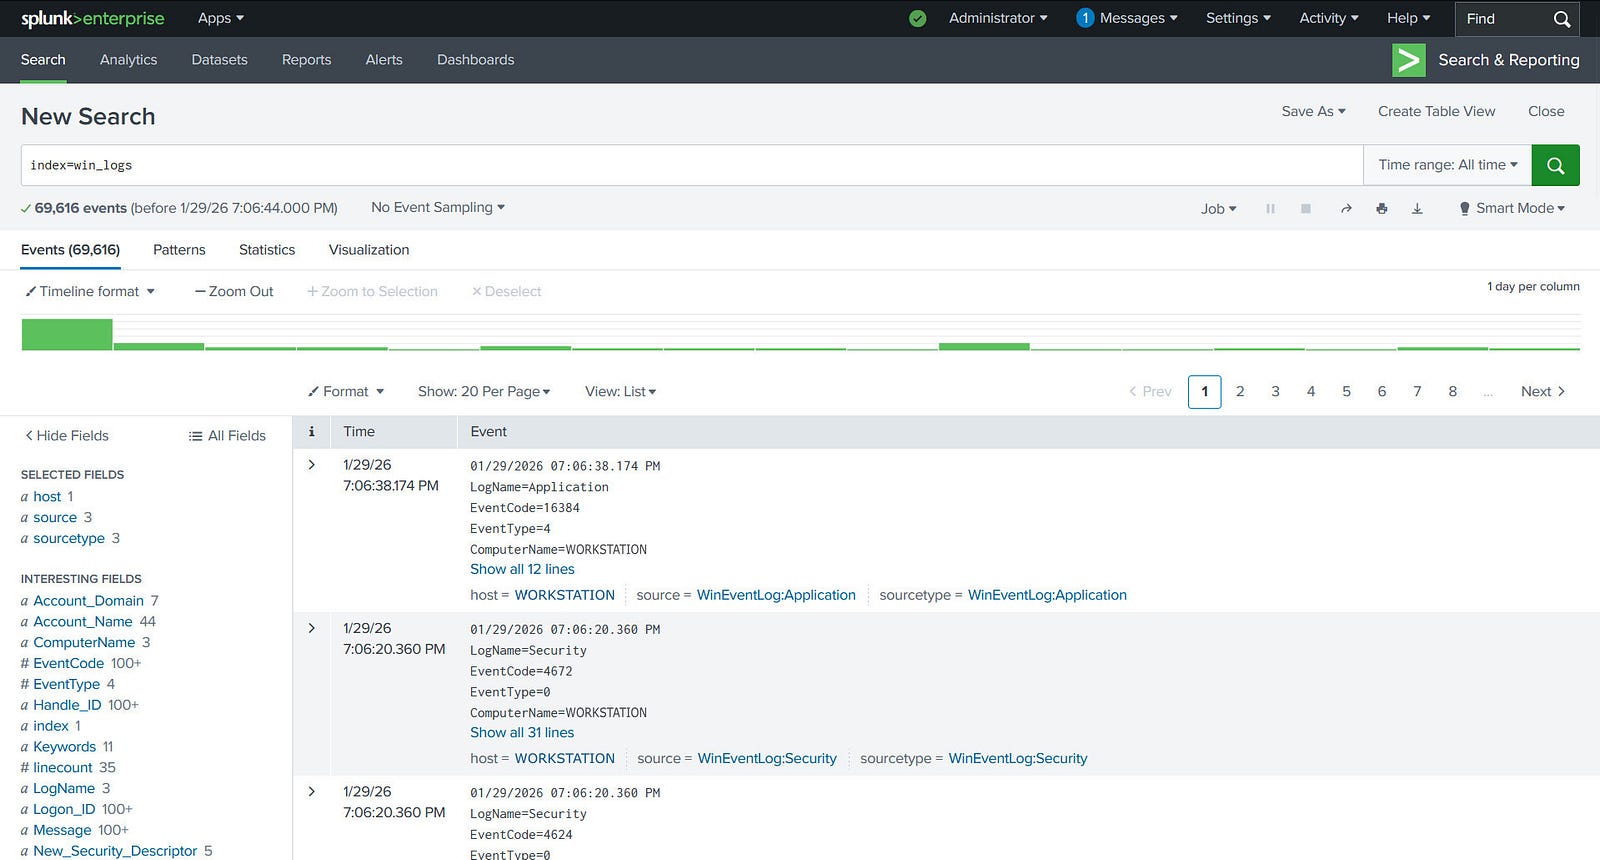
Retrieve all events from the win_logs index:
index=win_logs
If the installation and configuration were successful, all indexed results should appear.
In most of these practical exercises, I use a general query that searches for events containing the key-value pair:
Keywords="Audit Failure"
The “Audit Failure” keyword indicates a failure in an audited operation, such as failed logon attempts (Event ID 4625), account lockouts, or access denials to a resource. When ingested into Splunk, these events typically include:
This makes the dataset very practical for cybersecurity-oriented analysis, such as threat hunting or security investigations.
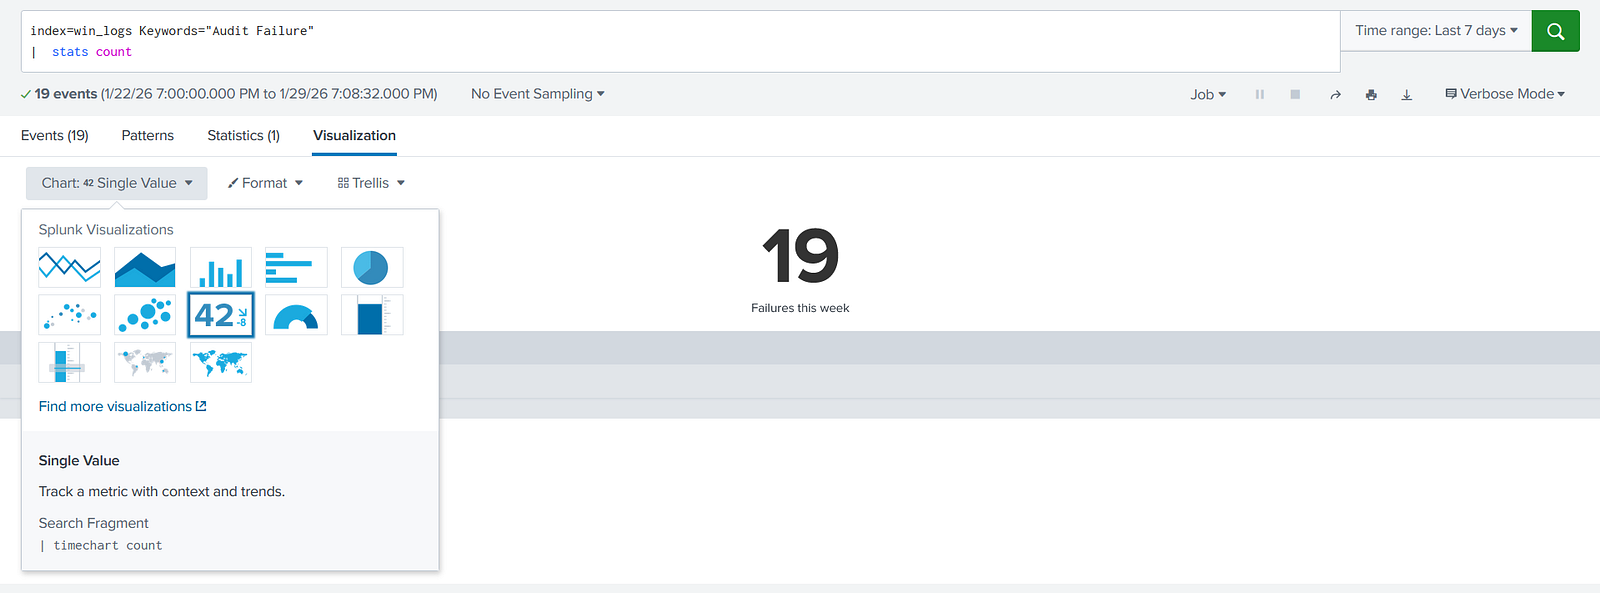
| stats countQuery:
index=win_logs Keywords="Audit Failure"
| stats count
This query counts all events containing "Audit Failure" in the Keywords field.
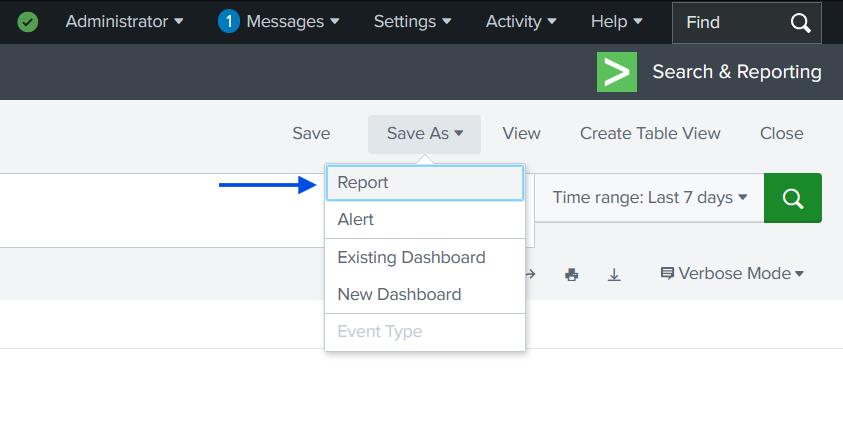
To analyze weekly activity, I set the Time Range picker to Last 7 days.

Then:
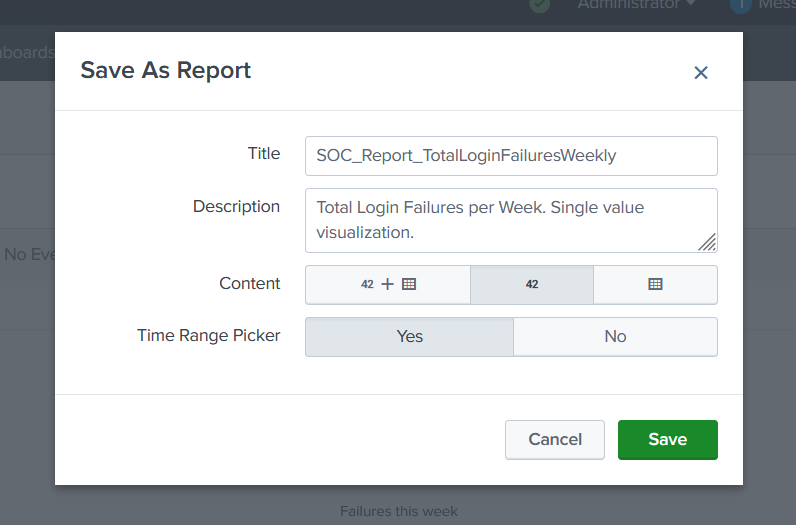
Visualization > Single ValueFailures this weekGroup_Type_DescriptionUsing consistent naming conventions helps maintain scalability and organization as dashboards grow.
| timechartindex=win_logs LogName=Security
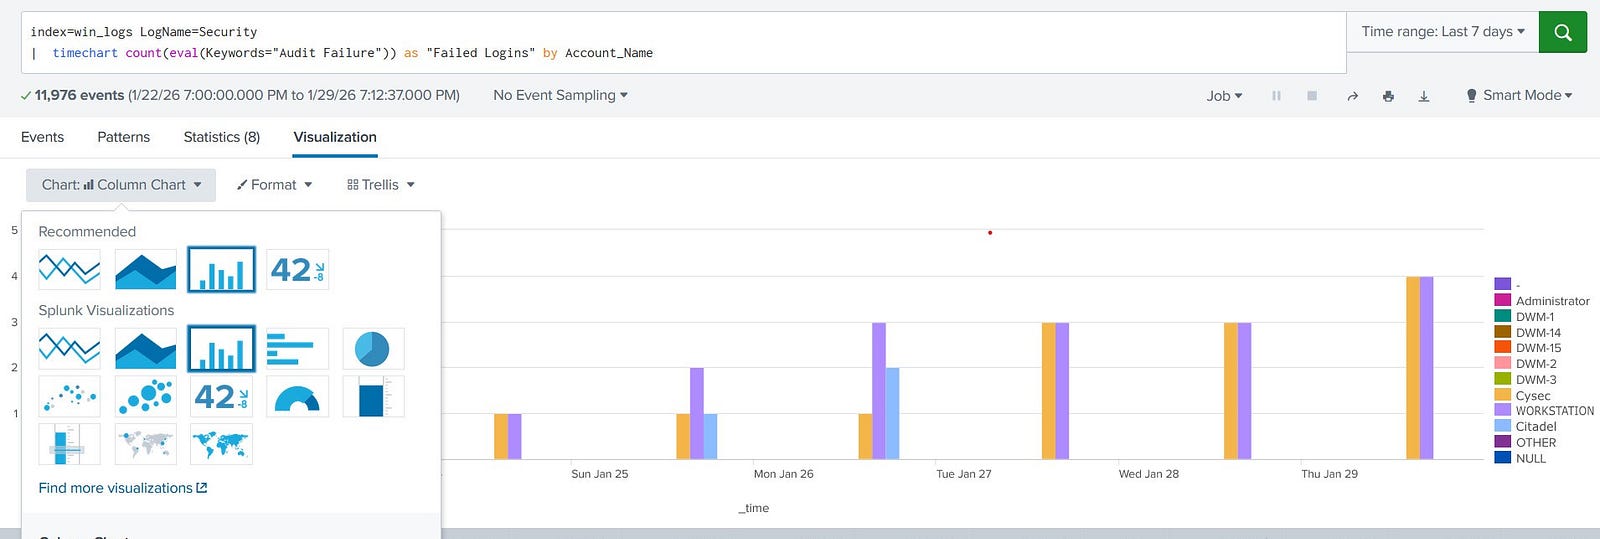
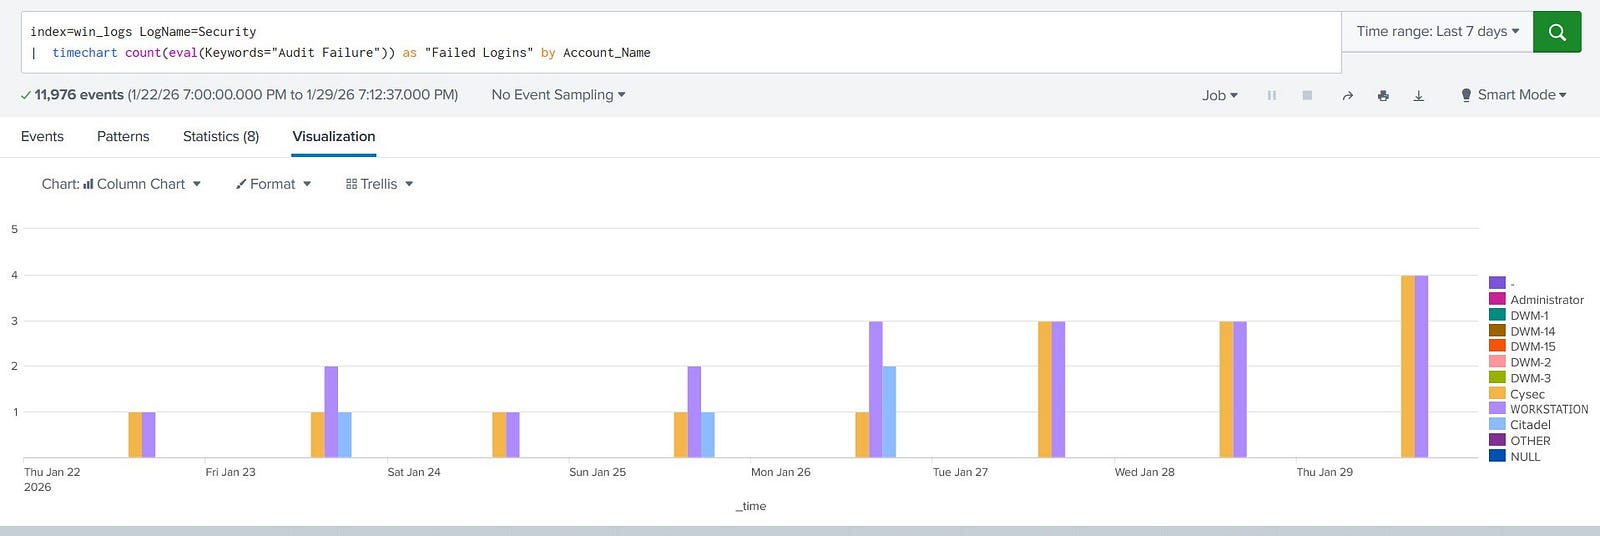
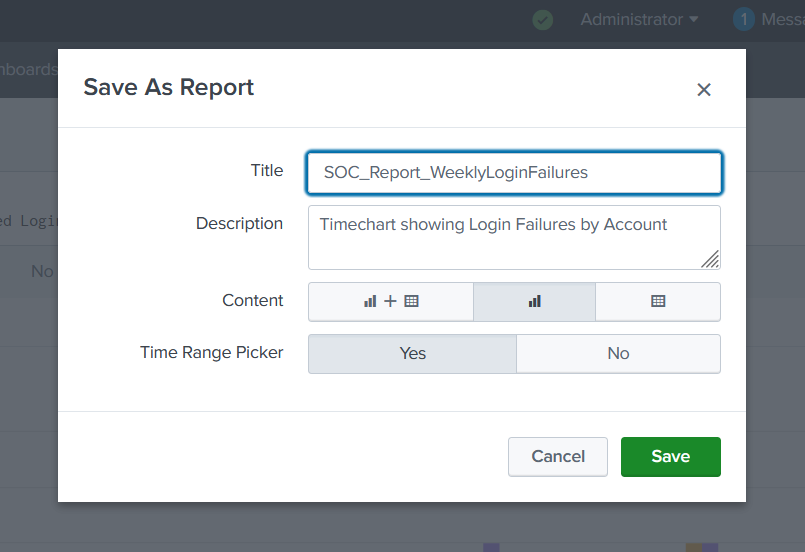
| timechart count(eval(Keywords="Audit Failure")) as "Failed Logins" by Account_Name
This query:
Account_NameUsing the Column Chart visualization allowed me to quickly identify:
This type of visualization is particularly useful for detecting abnormal authentication behavior.
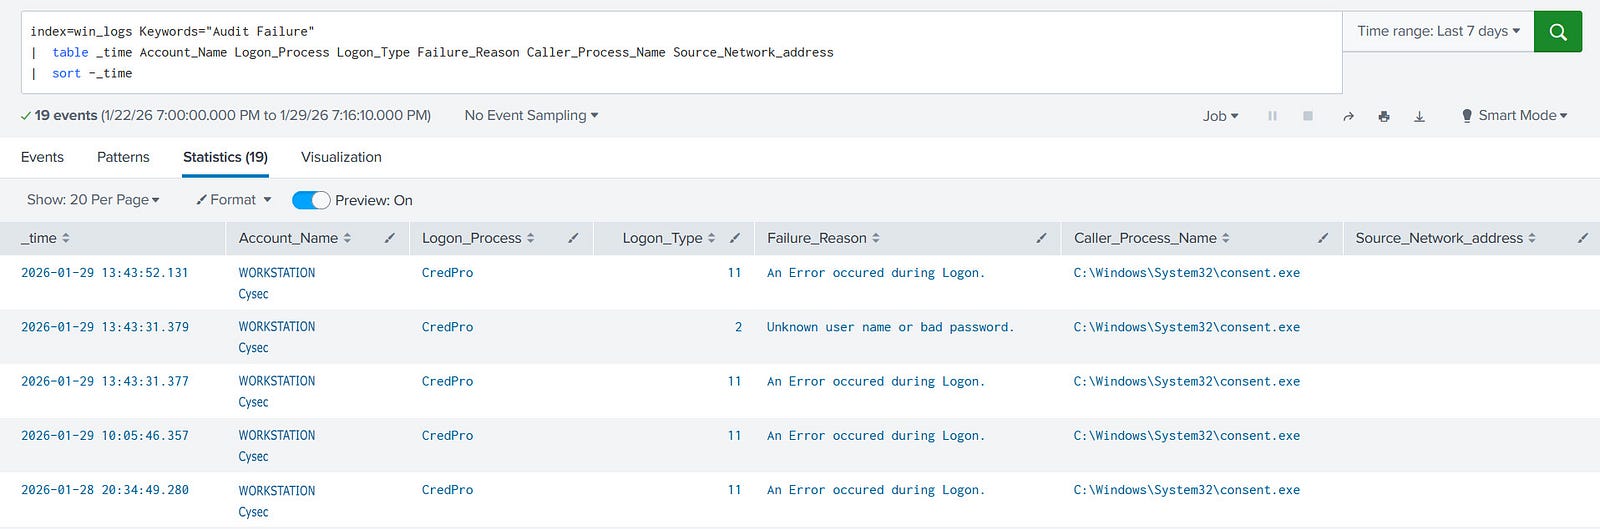
| table of Recent Failuresindex=win_logs Keywords="Audit Failure"
| table _time Account_Name Logon_Process Logon_Type Failure_Reason Caller_Process_Name Source_Network_Address
| sort -_time
Here:
| sort -_time to explicitly sort results in descending chronological order.Although Splunk sorts events in descending order by default, I prefer adding the sort command to make the search logic explicit and self-documented.
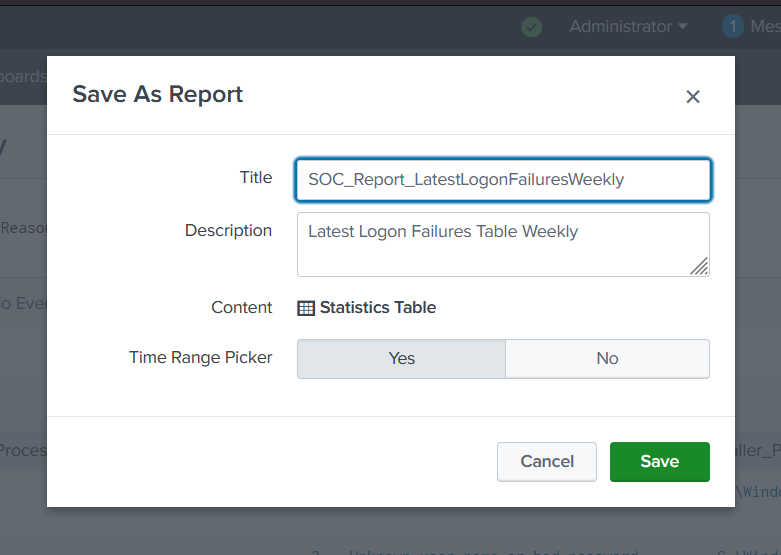
| top to Identify Failure Reasonsindex=win_logs Keywords="Audit Failure"
| top Failure_Reason
The | top command displays:
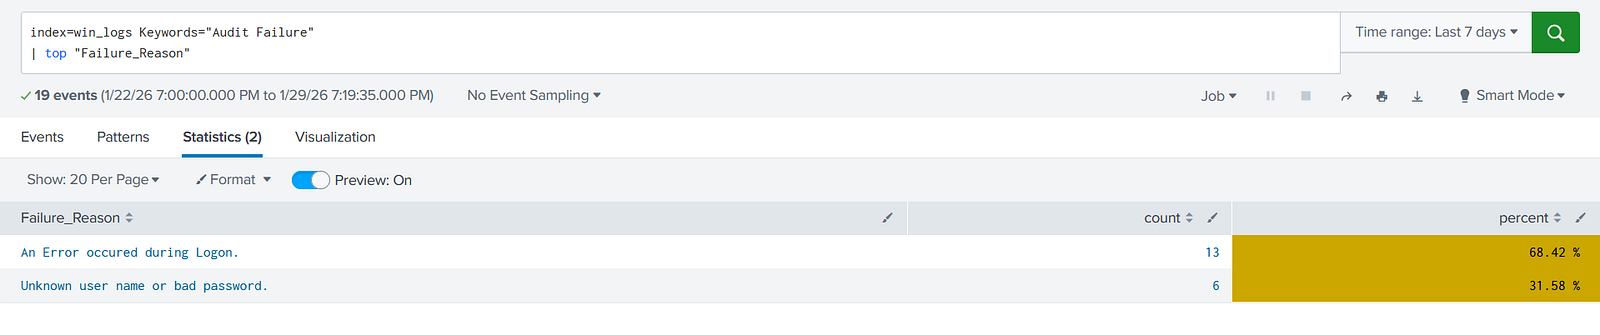
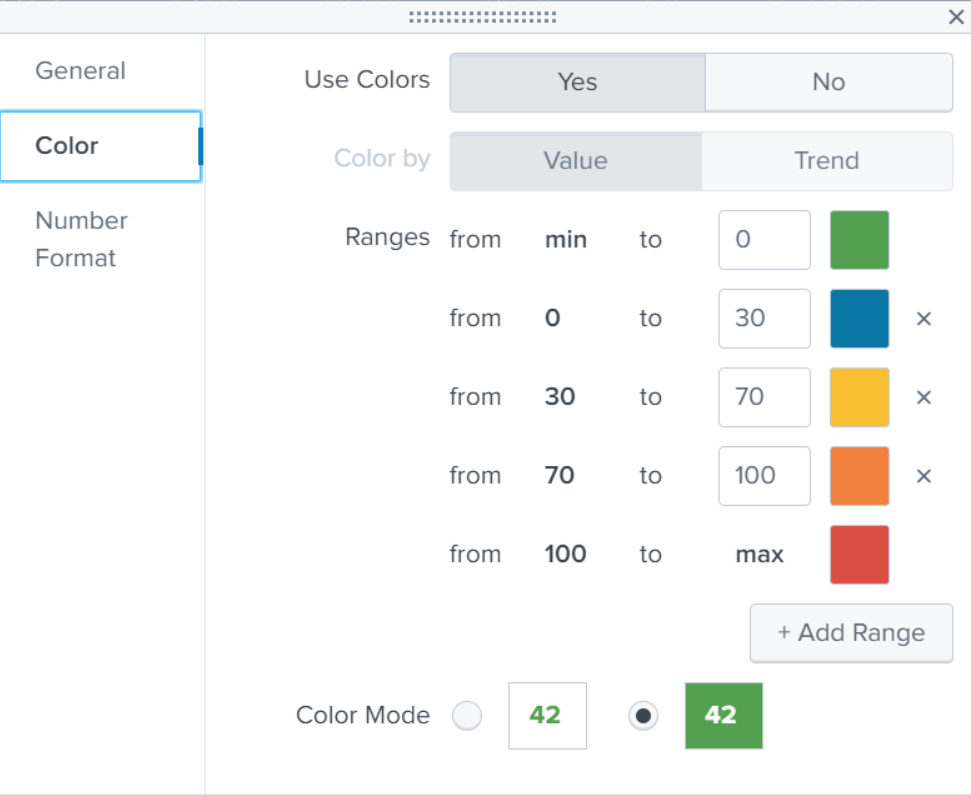
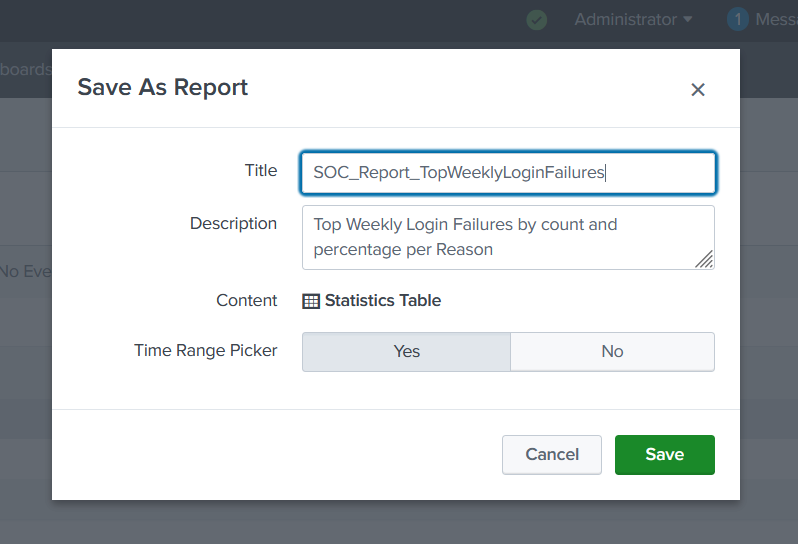
I customized the visualization using the Format menu and applied conditional coloring to emphasize the most frequent failure reasons.
This makes dashboards more visually intuitive and actionable.
index=win_logs Keywords="Audit Failure"
| timechart count
Then:
Visualization > Single ValueFailures this weekShow Trend IndicatorShow Trend in AbsoluteShow Sparkline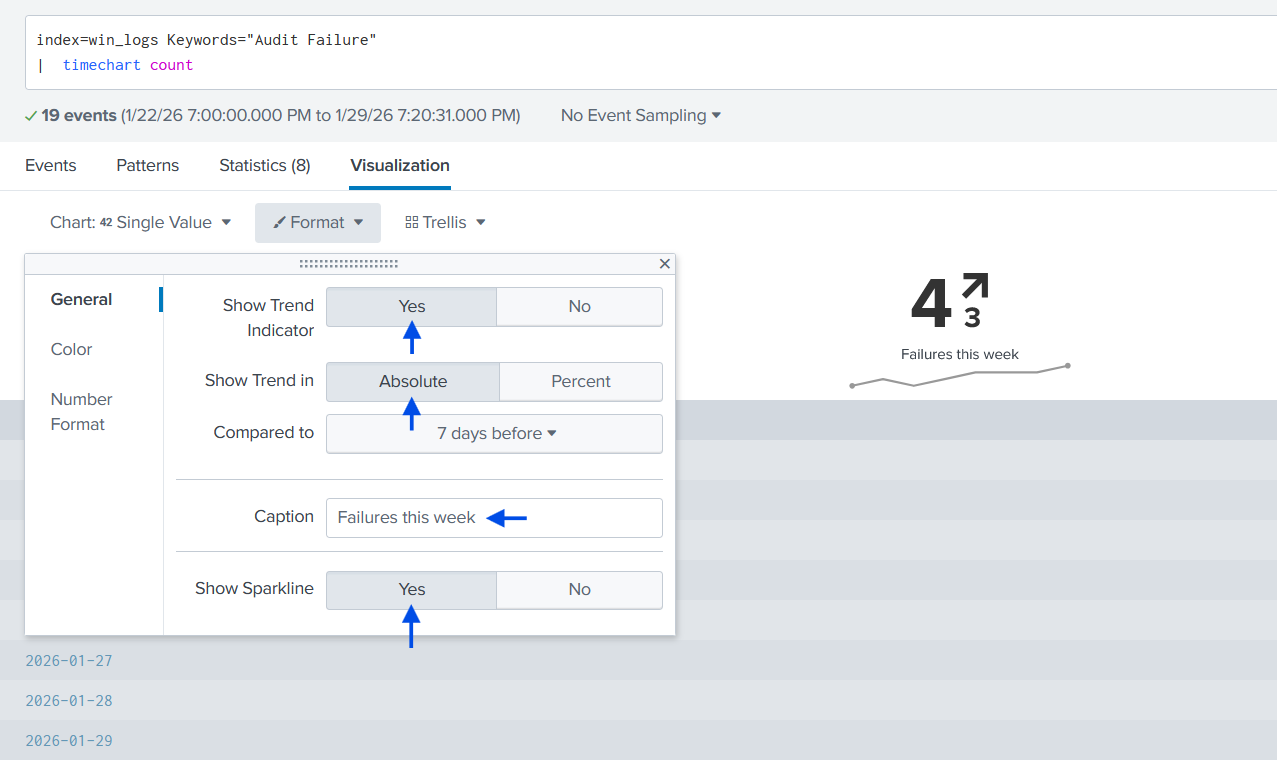
The result clearly shows the weekly trend and whether failures are increasing or decreasing.
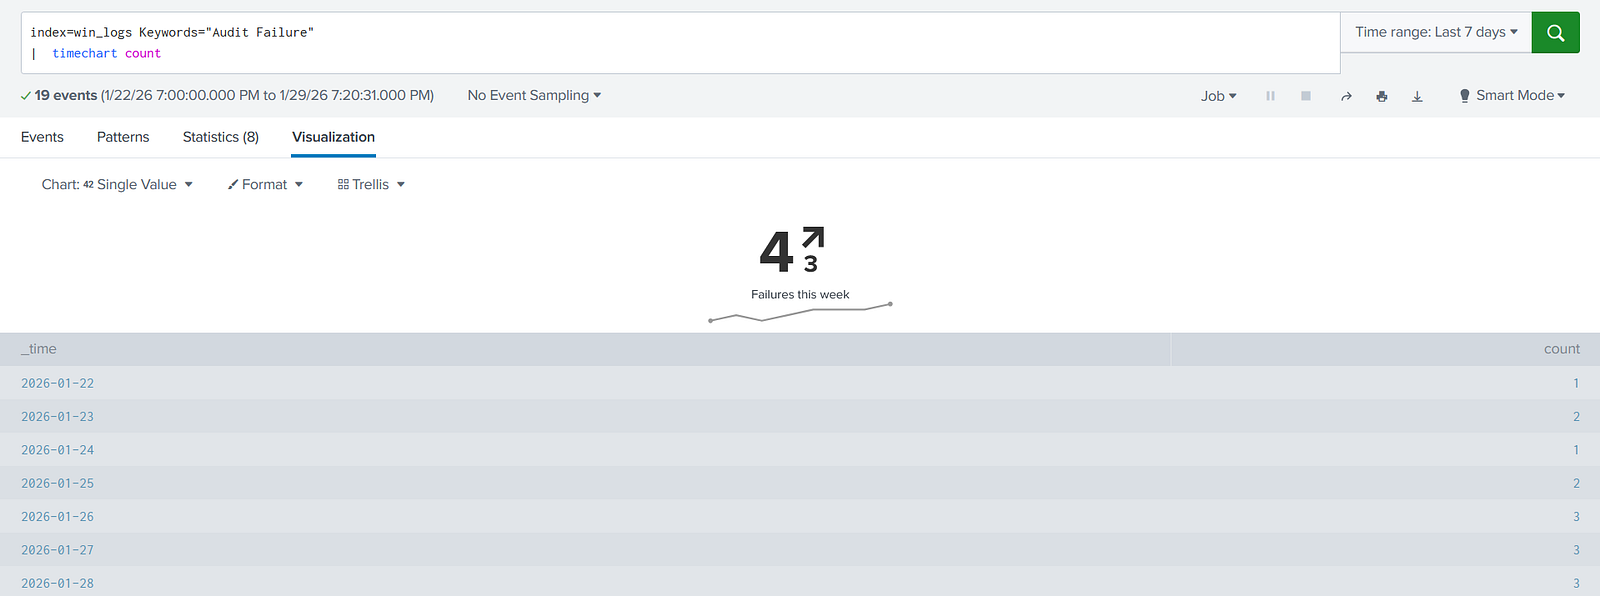
Trend indicators are particularly useful in operational security monitoring.
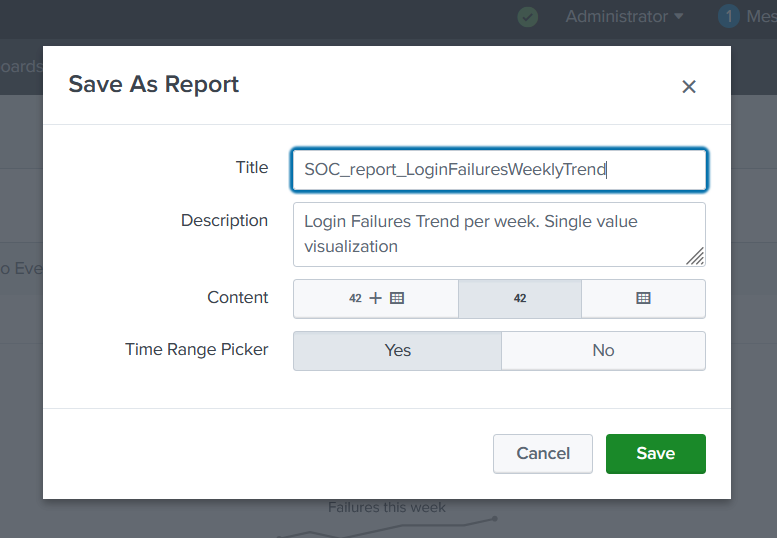
After creating several reports, I wanted to visualize everything in one place.
DashboardsCreate New DashboardClassic Dashboard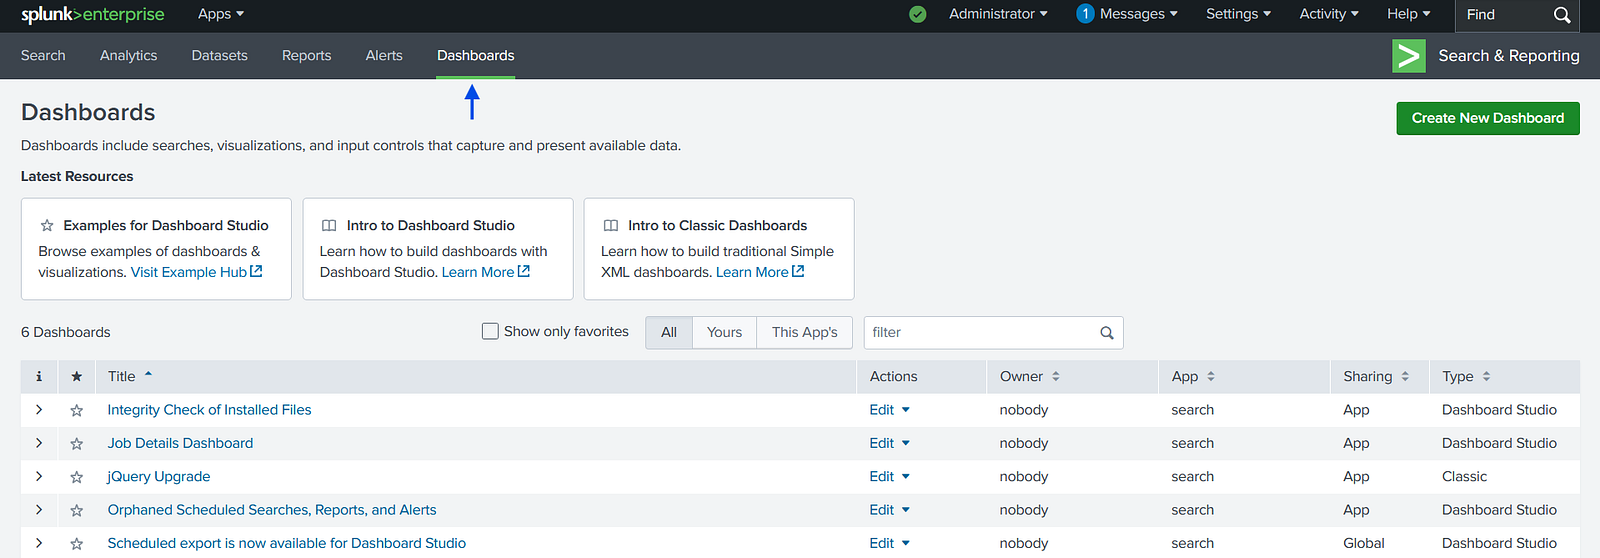
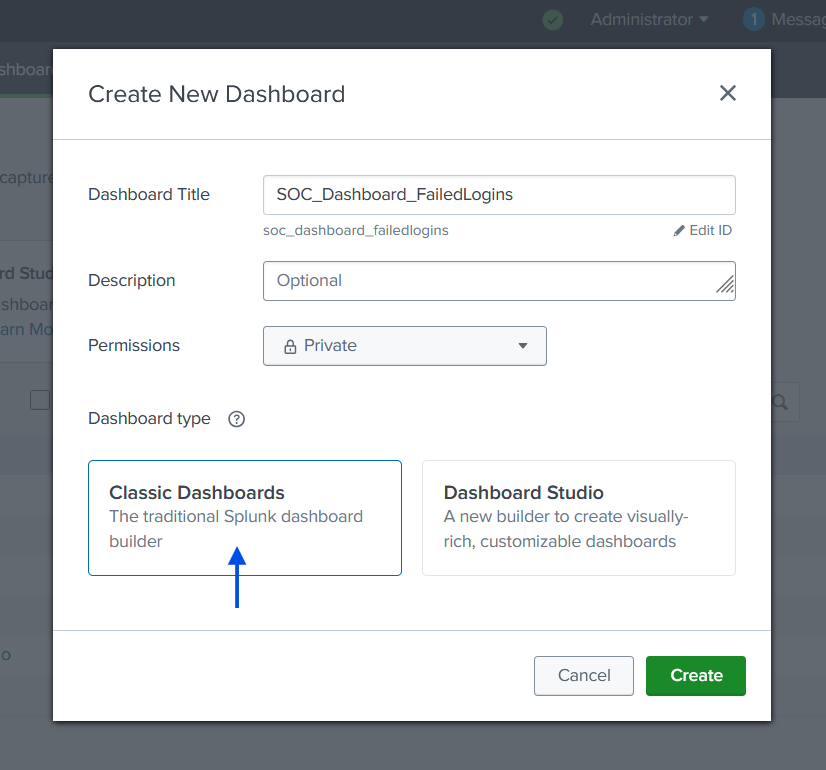
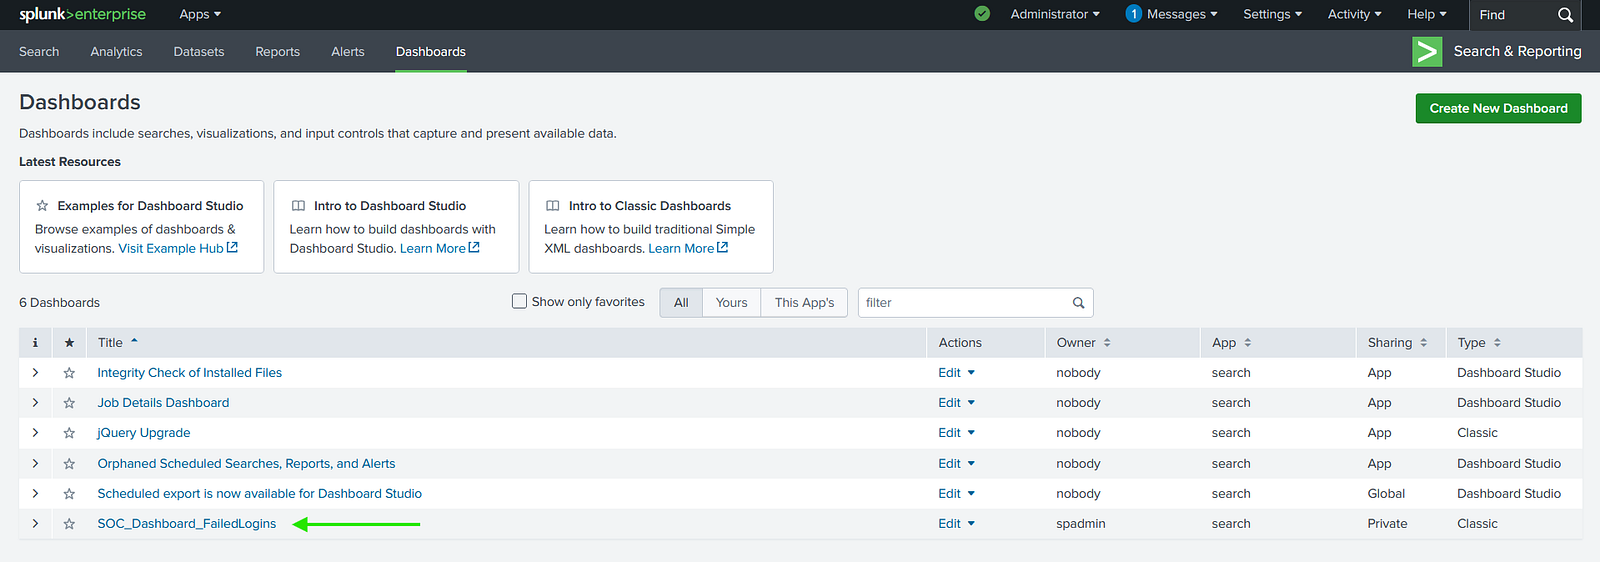
Dark Theme
+ Add Panel
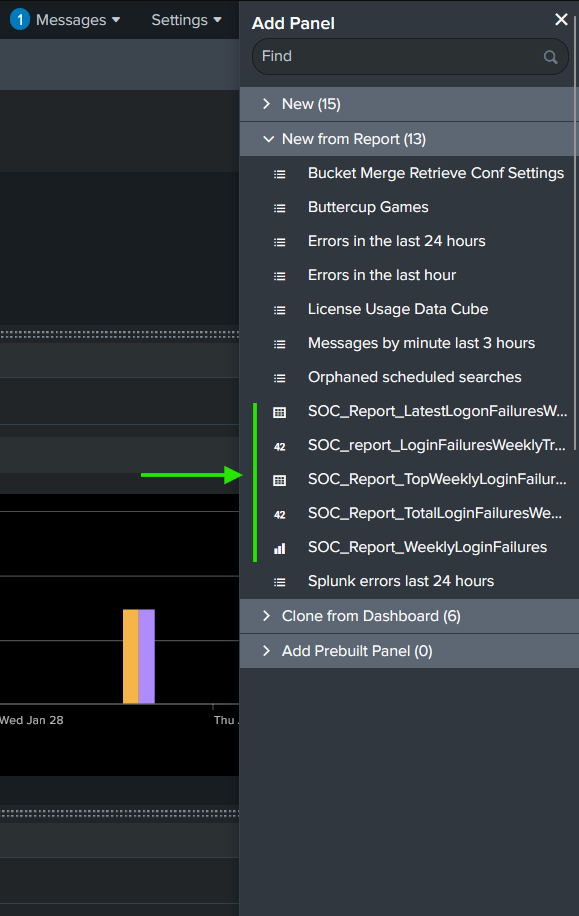
Repeated each step as necessary until adding all desired reports as panels

The final result was a centralized dashboard displaying:
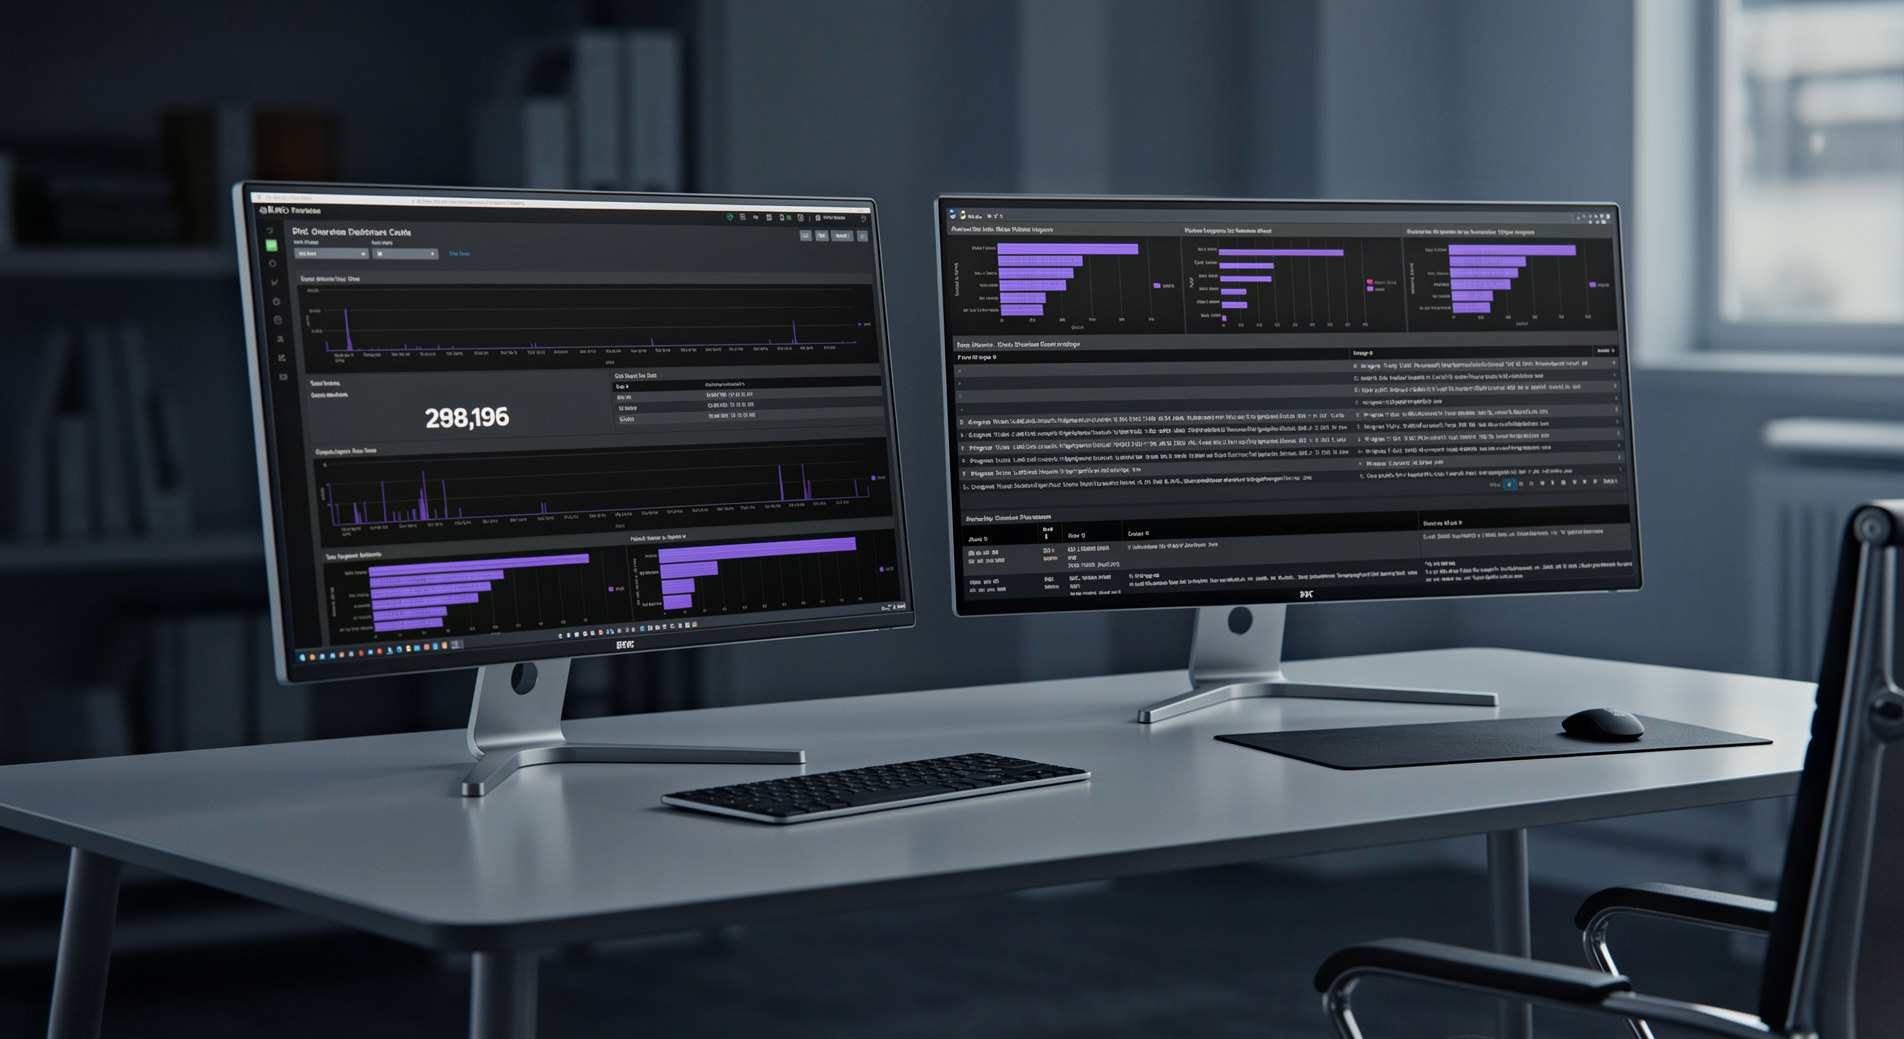
This created a practical authentication monitoring dashboard for my workstation.
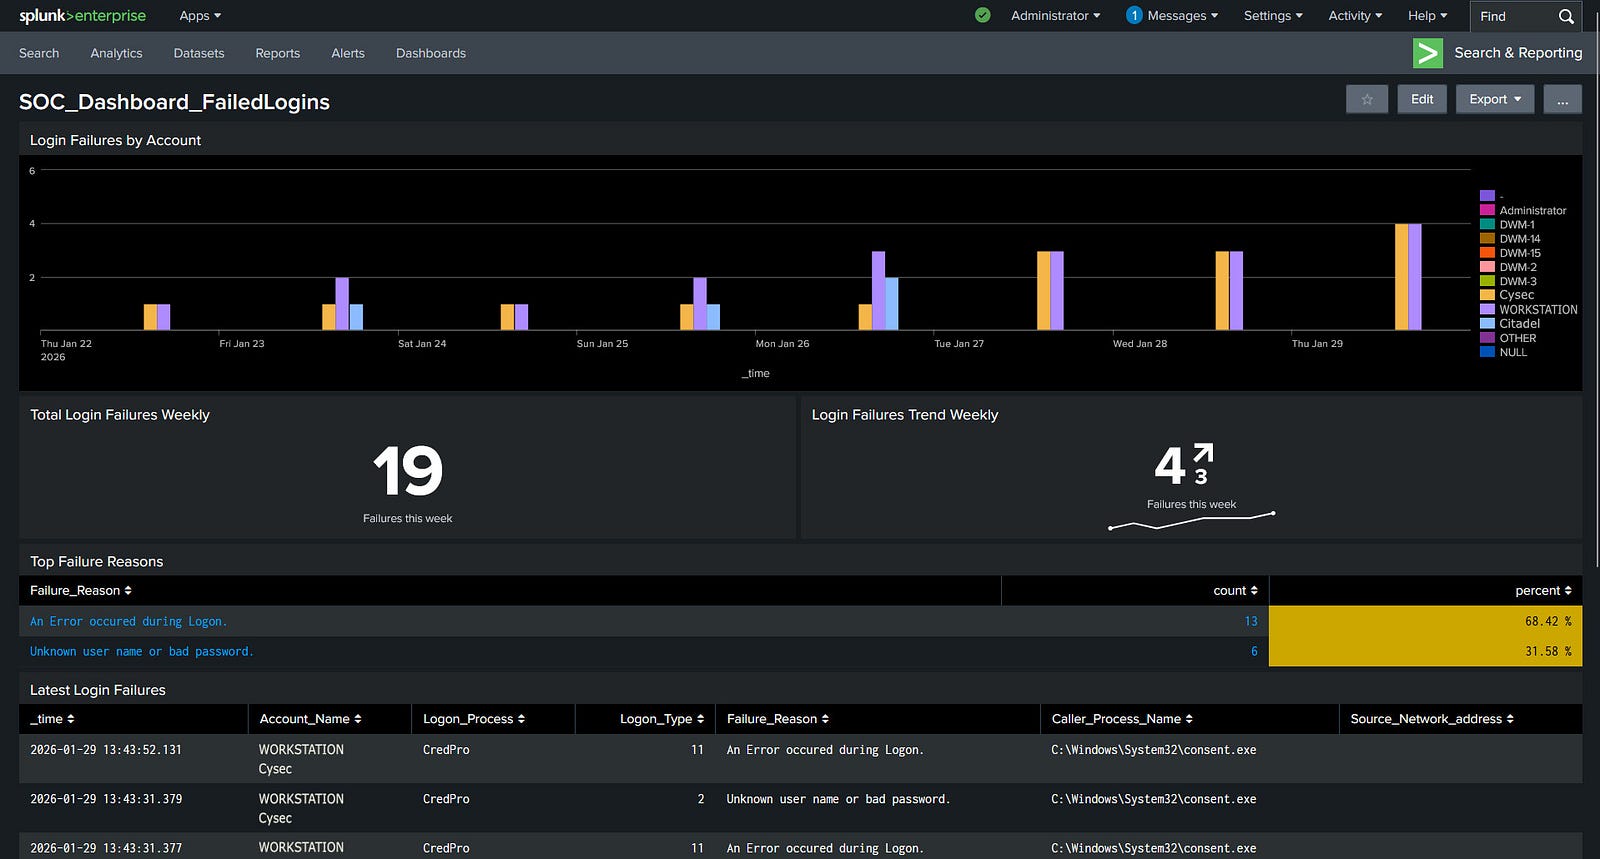
Final dashboard result
Don’t forget saving your changes at the end ;)

Dashboard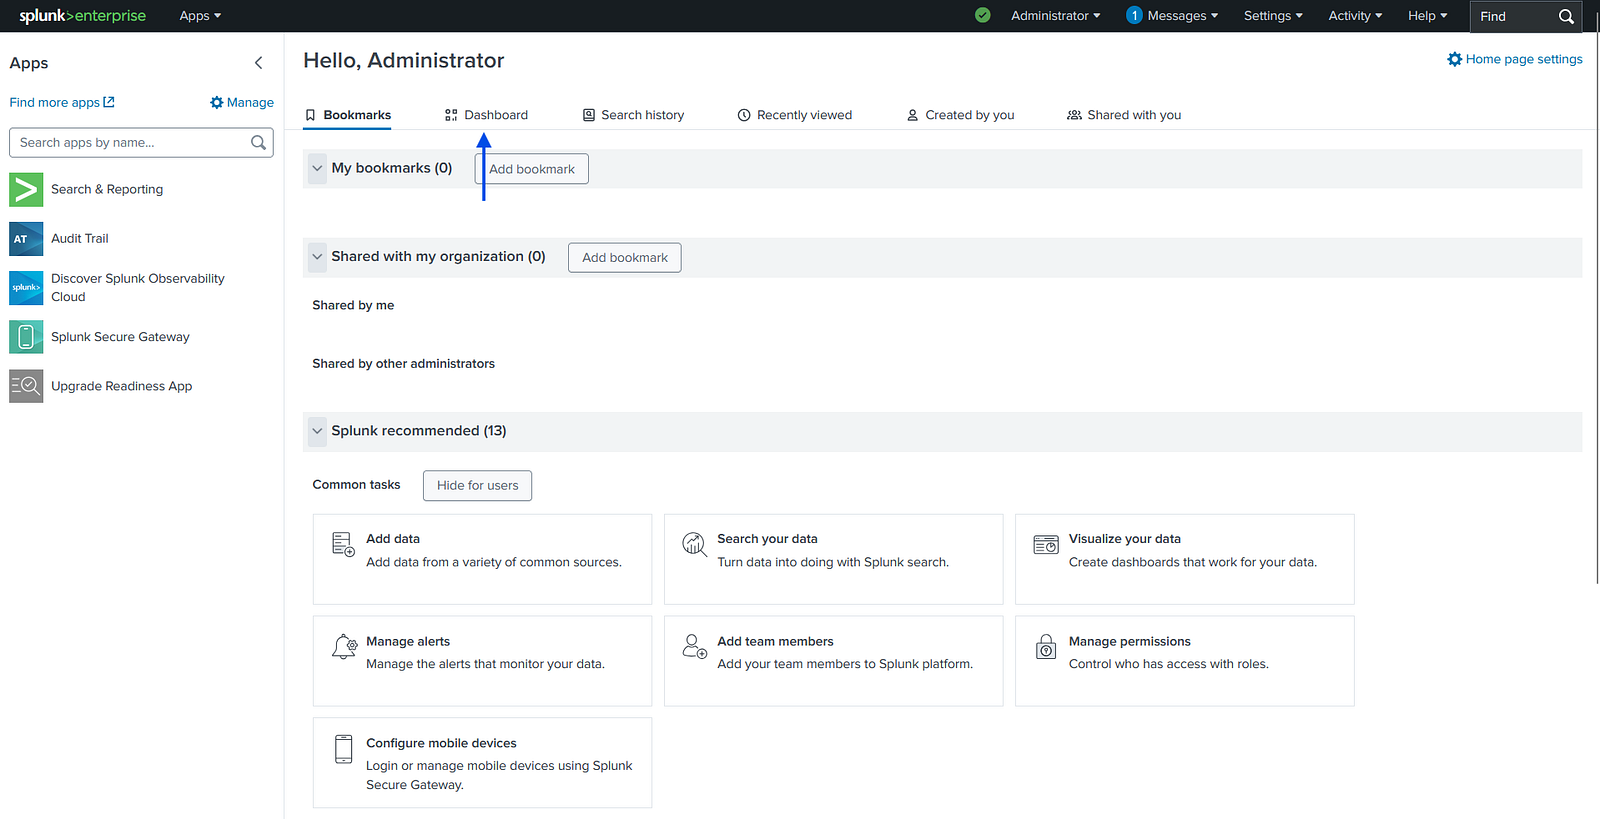
Choose a home dashboard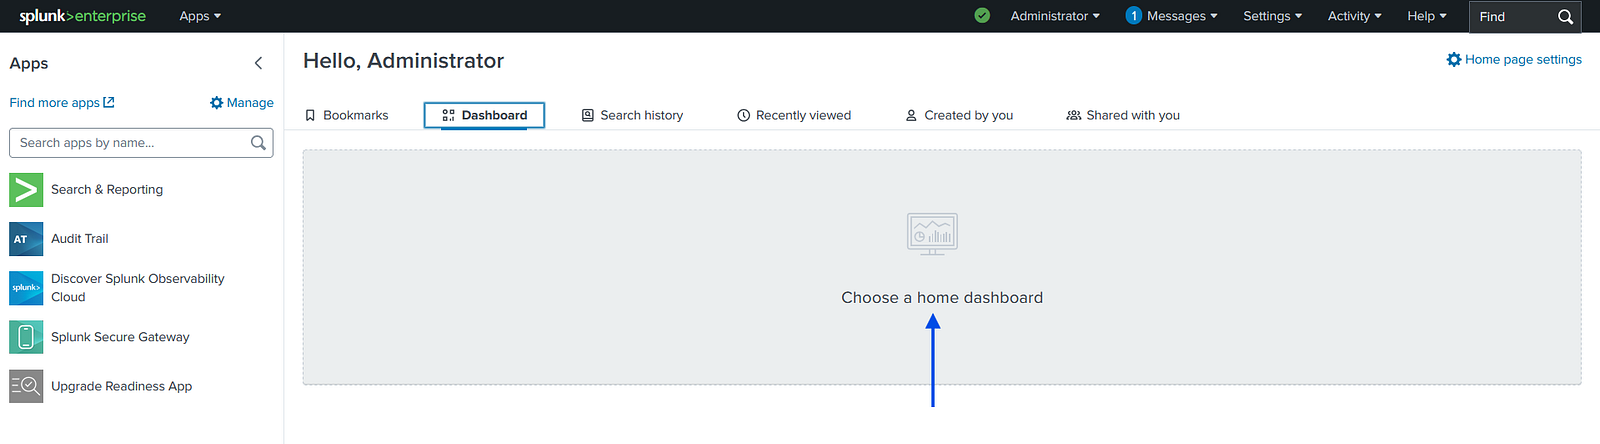
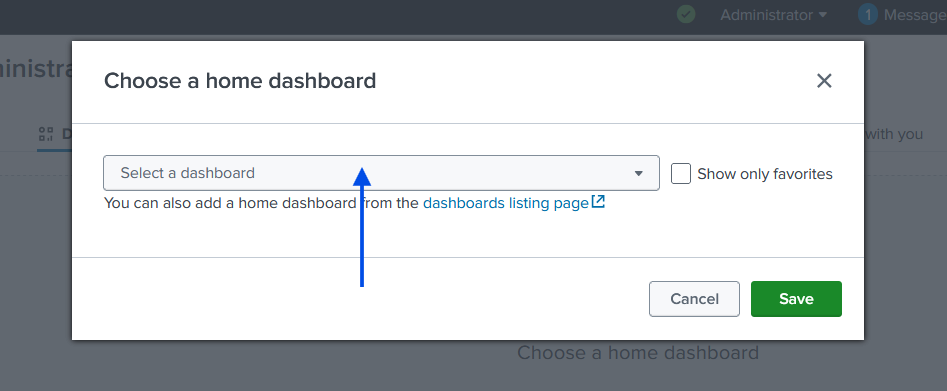
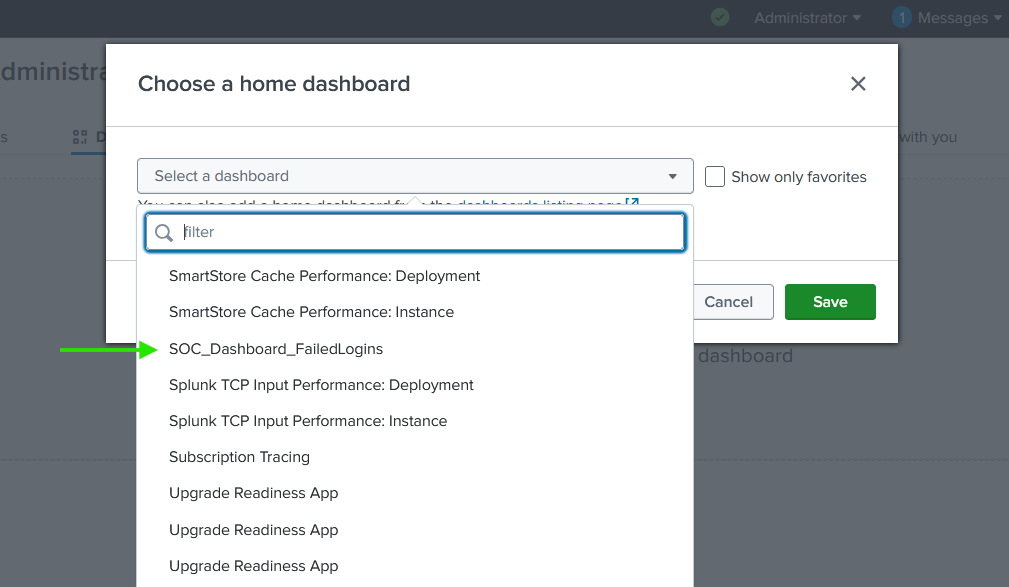
Now, authentication monitoring data is visible immediately upon login.
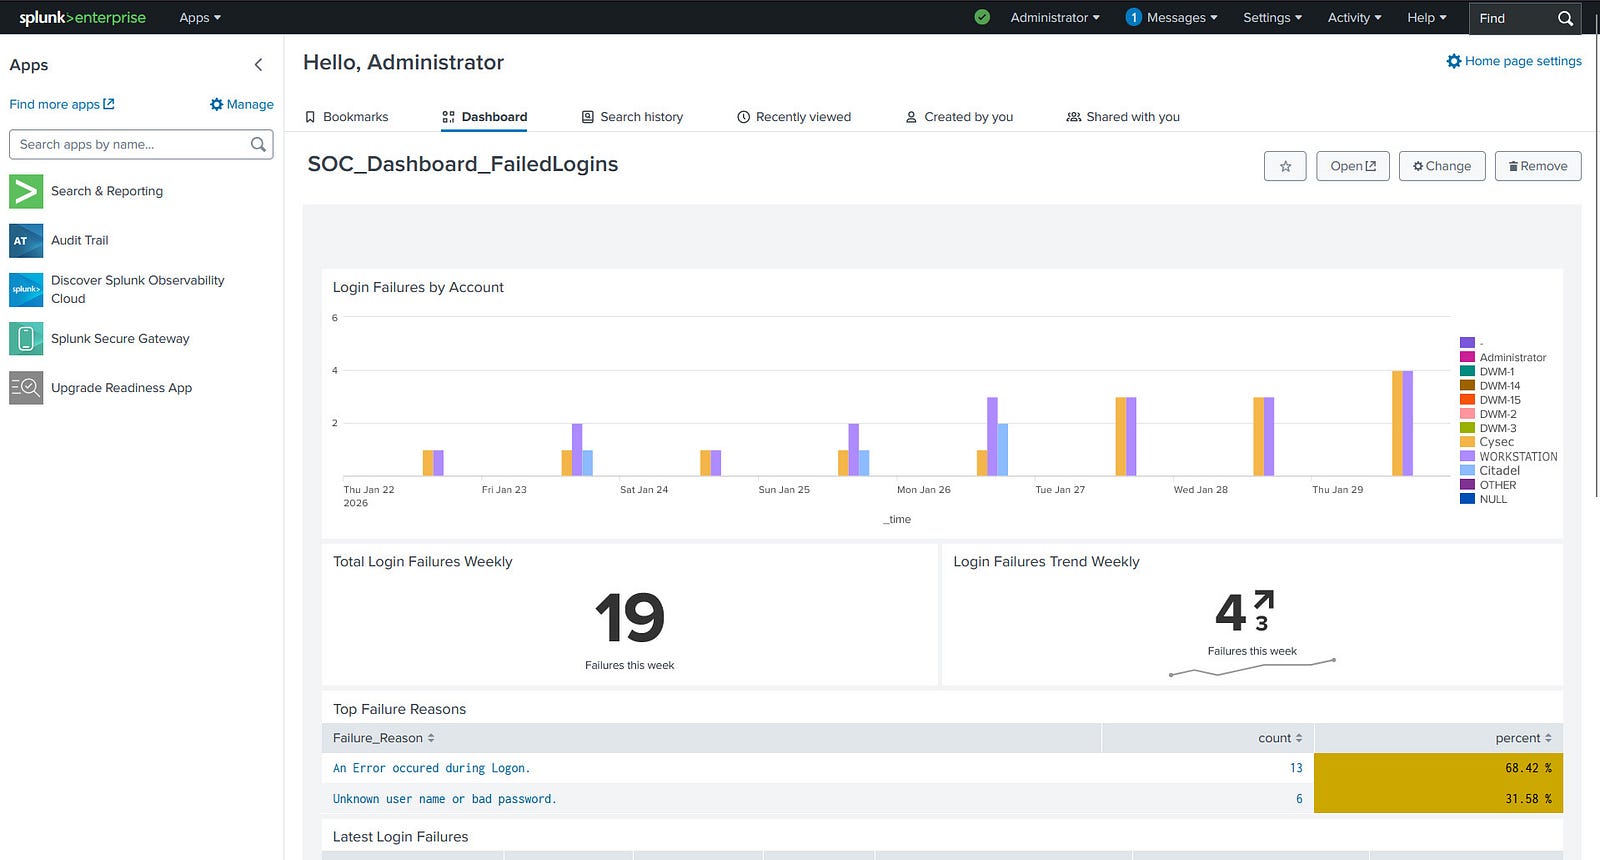
Home dashboard, final result
Building this Splunk homelab significantly improved my understanding of the Splunk interface, SPL commands, reporting workflows, and dashboard design.
If you are preparing for the Splunk Certified Core User exam or want structured, hands-on practice with real Windows event logs, this lab provides a solid and practical foundation. Beyond certification preparation, it also introduces core concepts used in security monitoring and threat detection environments.
Hands-on experimentation remains one of the most effective ways to truly understand Splunk, an essential SIEM tool for any Defensive Security professional.
“Splunk is a key player in the field of cybersecurity, enabling users to visualize data in a meaningful way and respond to incidents faster” — Splunk Blog
While the approach outlined in this guide provides a great starting point and serves its purpose as a practical exercise to prepare for the Splunk Certified Core User exam, there are many other ways to enhance your Splunk homelab. Here are a few alternative exercises:
Query Common Windows Security Events
Instead of querying the Keyword field, focus on Windows security events like:
And analyze logon types, such as:
Integrate Sysmon for Detailed Event Logging
Install Sysmon to capture more granular system data and forward these logs to Splunk. Key Sysmon events include process creation, network connections, and file modifications.
Forward Logs from Other Machines
Expand your lab by collecting logs from other systems in your network. Set up forwarders to send logs from additional machines to Splunk for a more comprehensive analysis.
These approaches can deepen your knowledge and provide a broader view of your network’s security.
A detection-engineering exercise using Sigma, Splunk, Windows telemetry, and Atomic Red Team to validate vendor-neutral detection logic
How to Validate PowerShell Detections in Splunk with Sysmon, Atomic Red Team, and MITRE ATT&CK
Designing an Operational Monitoring Dashboard for Authentication, Endpoint, Network, and Threat Hunting Visibility