


From Splunk to Sigma: Building and Validating Vendor-Neutral Detection Logic
A detection-engineering exercise using Sigma, Splunk, Windows telemetry, and Atomic Red Team to validate vendor-neutral detection logic


In this write-up, I investigate the TryHackMe room “New Hire, Old Artifacts”, which focuses on analyzing malicious activity on a compromised Windows workstation using Sysmon logs and Splunk queries and I explain the methodology I used to identify suspicious artifacts and investigate the actions performed by the attacker.
This type of investigation closely reflects tasks performed by Security Operations Center (SOC) analysts, where log analysis and event correlation are used to detect malicious behavior and reconstruct attacker activity.
Platform: TryHackMe
Scenario: Investigating malicious activity on a compromised Windows workstation
Tools Used: Splunk, Sysmon logs
Focus Areas:
This investigation demonstrates practical blue team and SOC analyst skills, including log analysis, threat hunting, and attacker behavior identification.
Process: I queried the Sysmon sourcetype and searched for EventCode=1, which corresponds to process creation events.
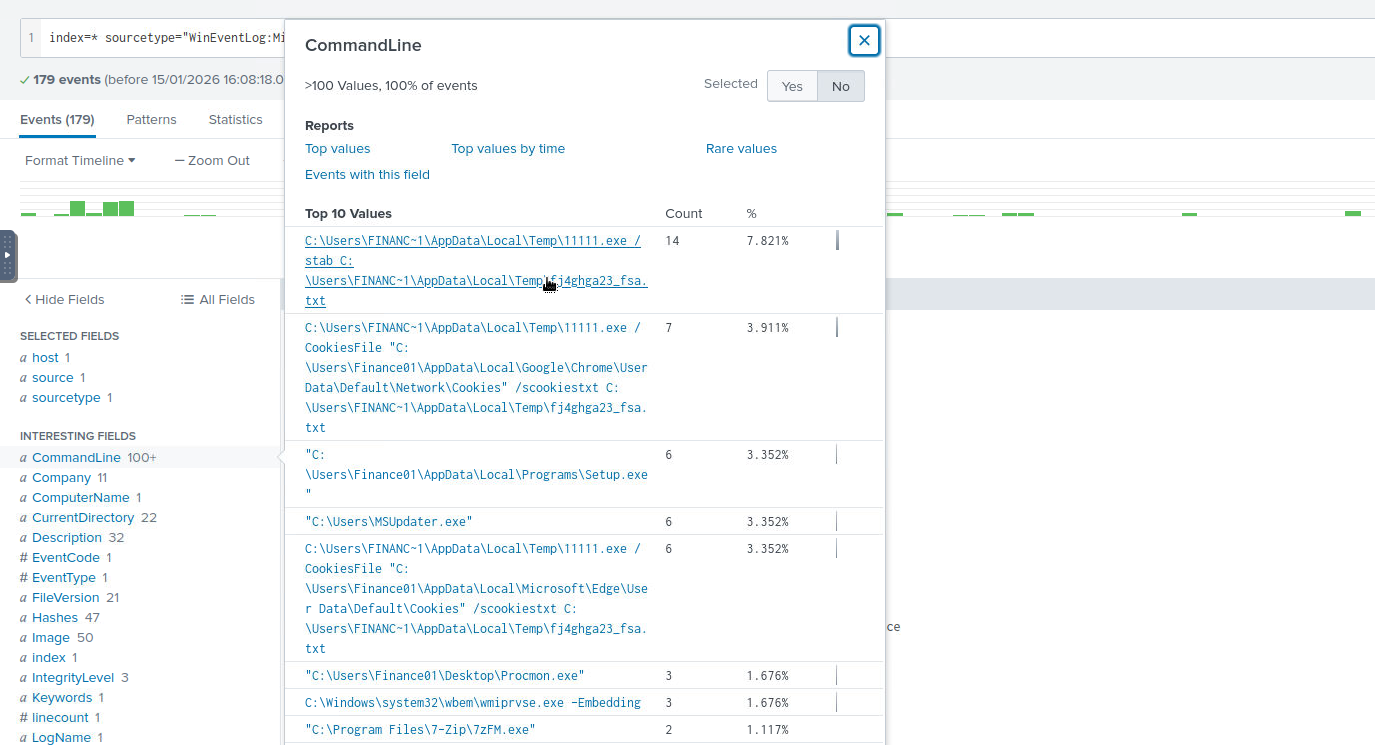
I then examined the top results of the CommandLine field to identify suspicious executables.
Among the results, I detected a suspicious binary name.
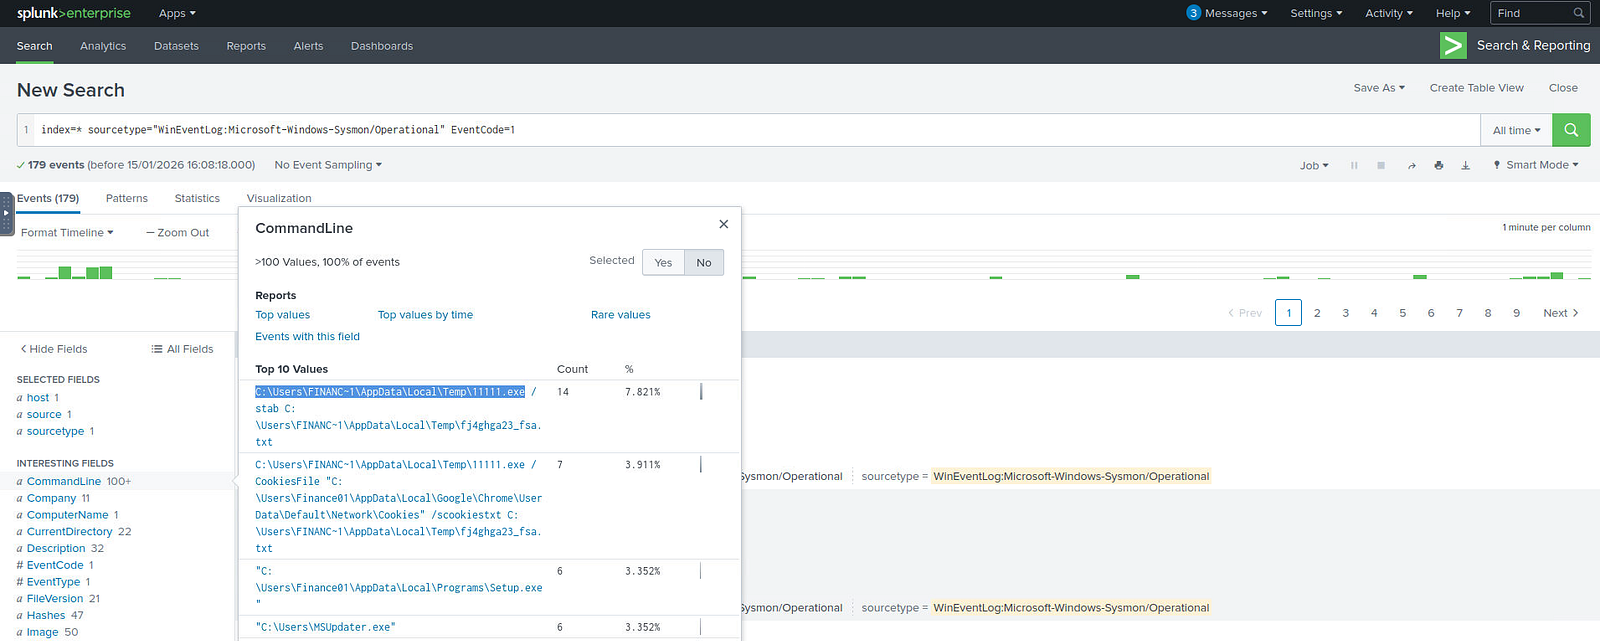
Answer: C:\Users\FINANC~1\AppData\Local\Temp\11111.exe
Process: To investigate further, I isolated one of the events associated with the malicious executable by selecting one of the entries from the CommandLine field that showed its execution.
I then inspected the event fields and located the Company field, which contained the value requested in the question.
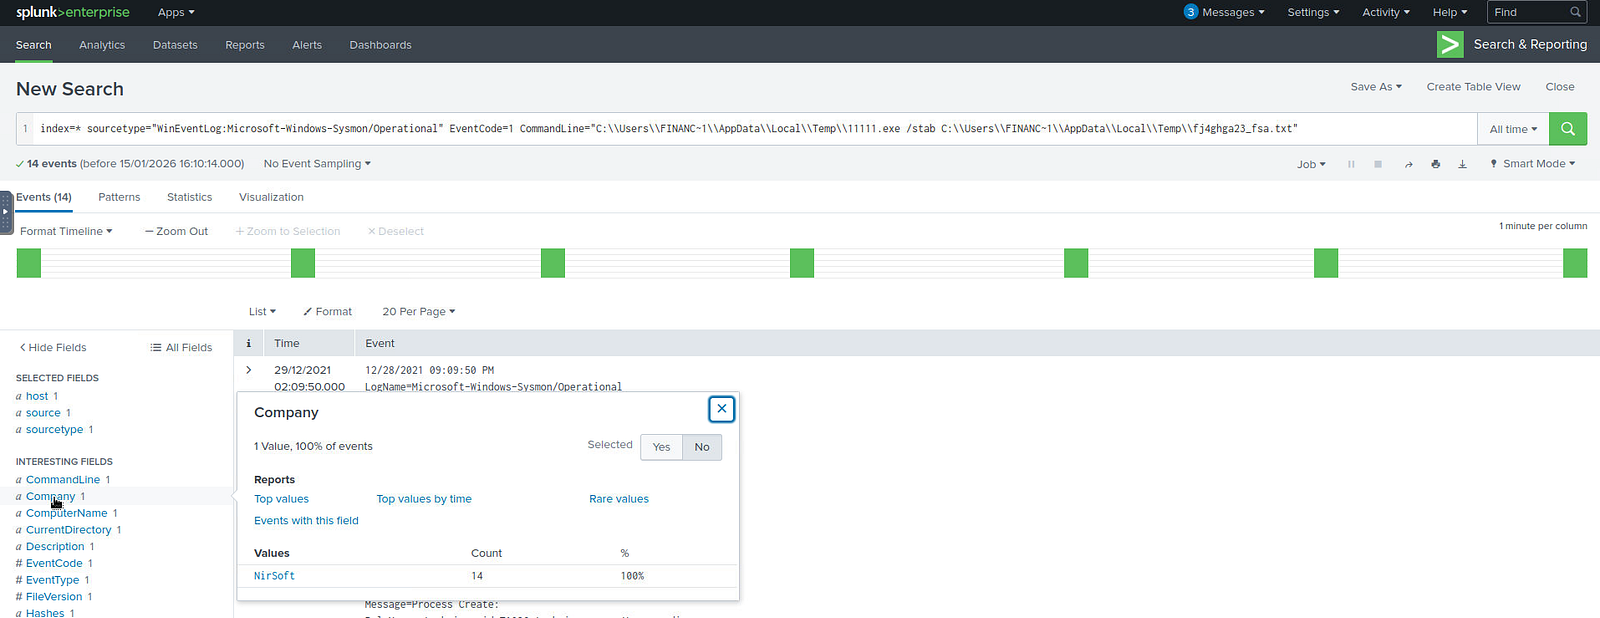
Answer: NirSoft
Process: First, I reviewed the ComputerName field of the previous event and noted the system name.
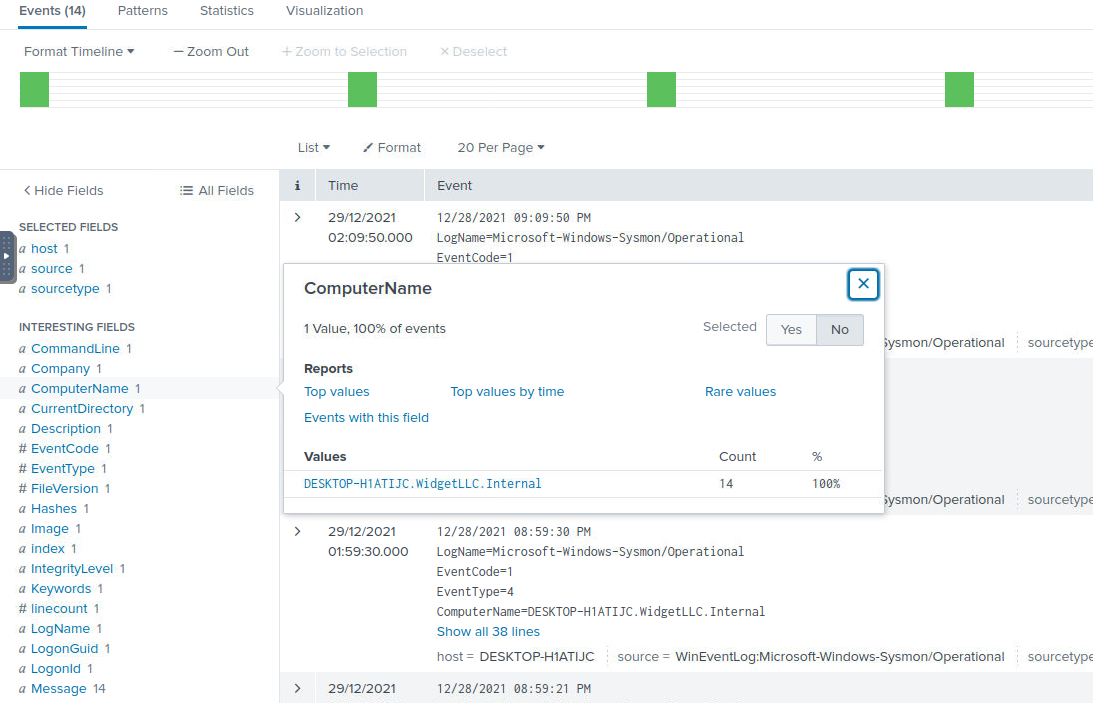
Next, I checked the CurrentDirectory field to determine the folder from which the executable was launched.
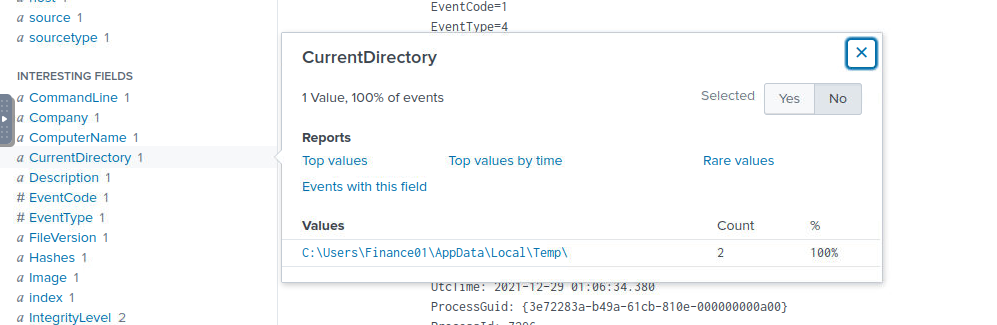
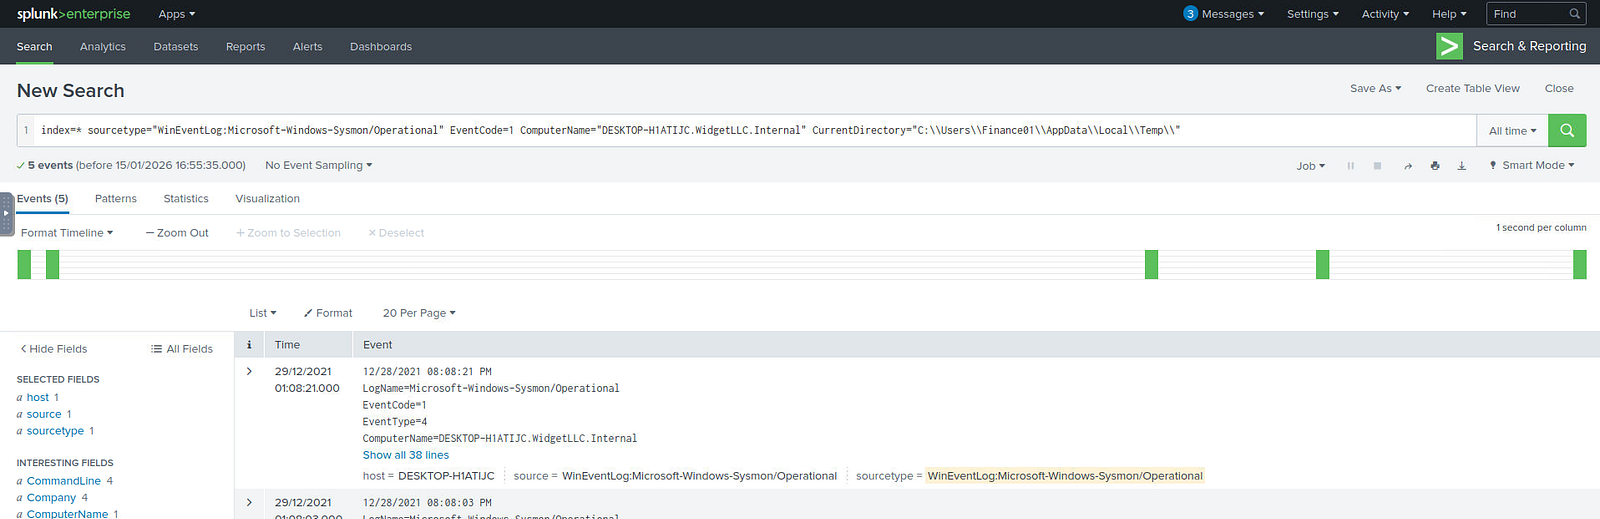
Using this information, I created a new Splunk query filtering by both fields and searched again in the Sysmon logs for EventCode=1 to identify additional process executions.
Since the question also required the original filename, I inspected the OriginalFileName field and identified a suspicious value: PalitExplorer.exe.
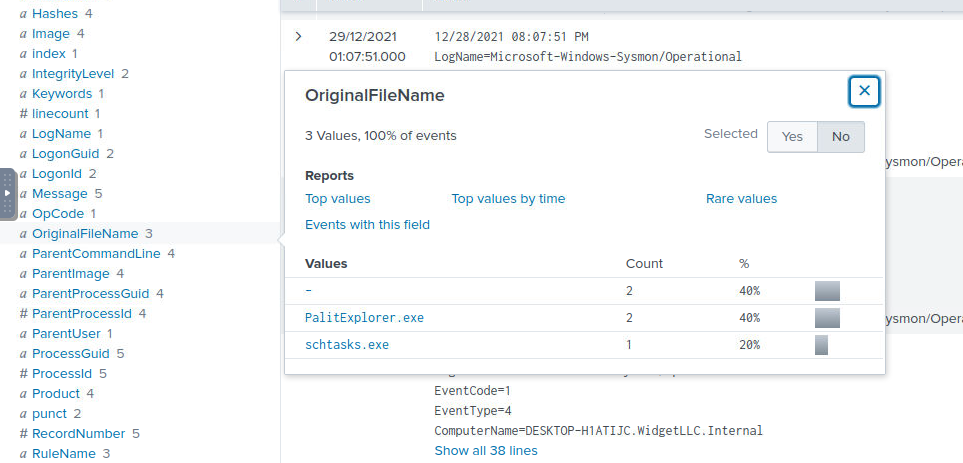
Using this field to further narrow the search results, I identified the relevant event.
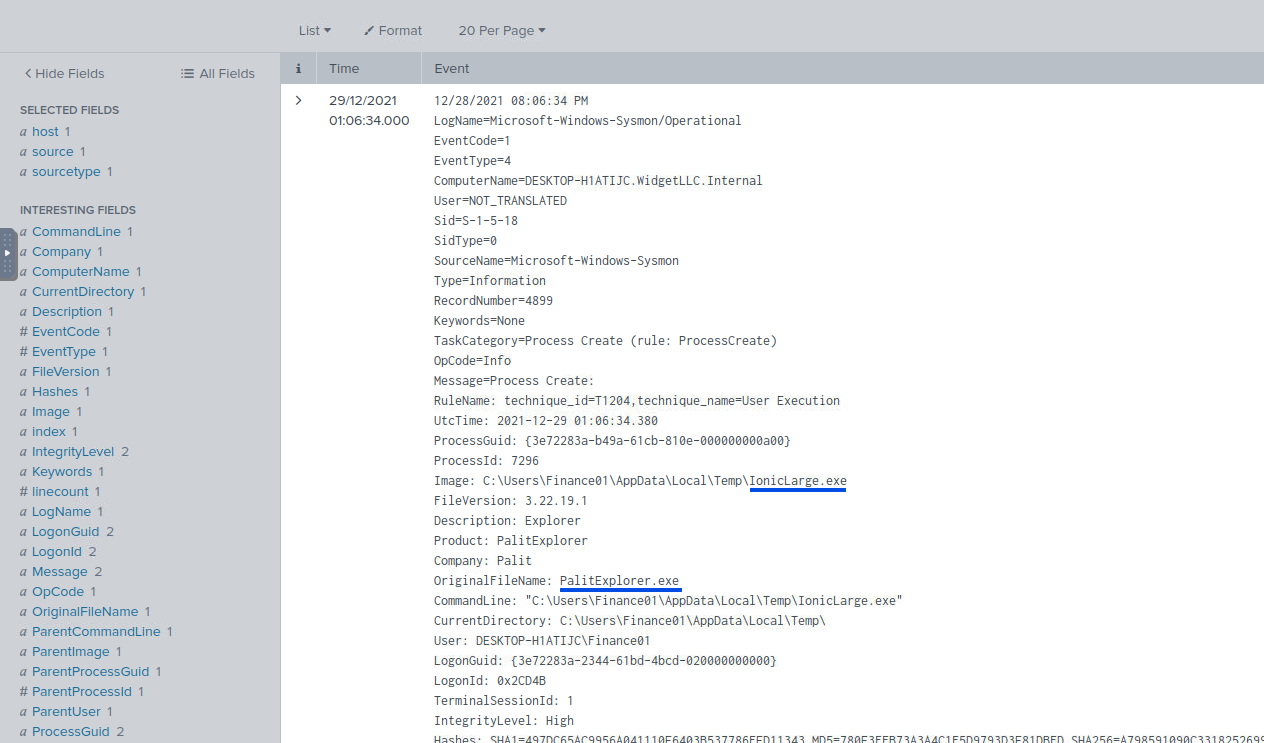
Answer: IonicLarge.exe,PalitExplorer.exe
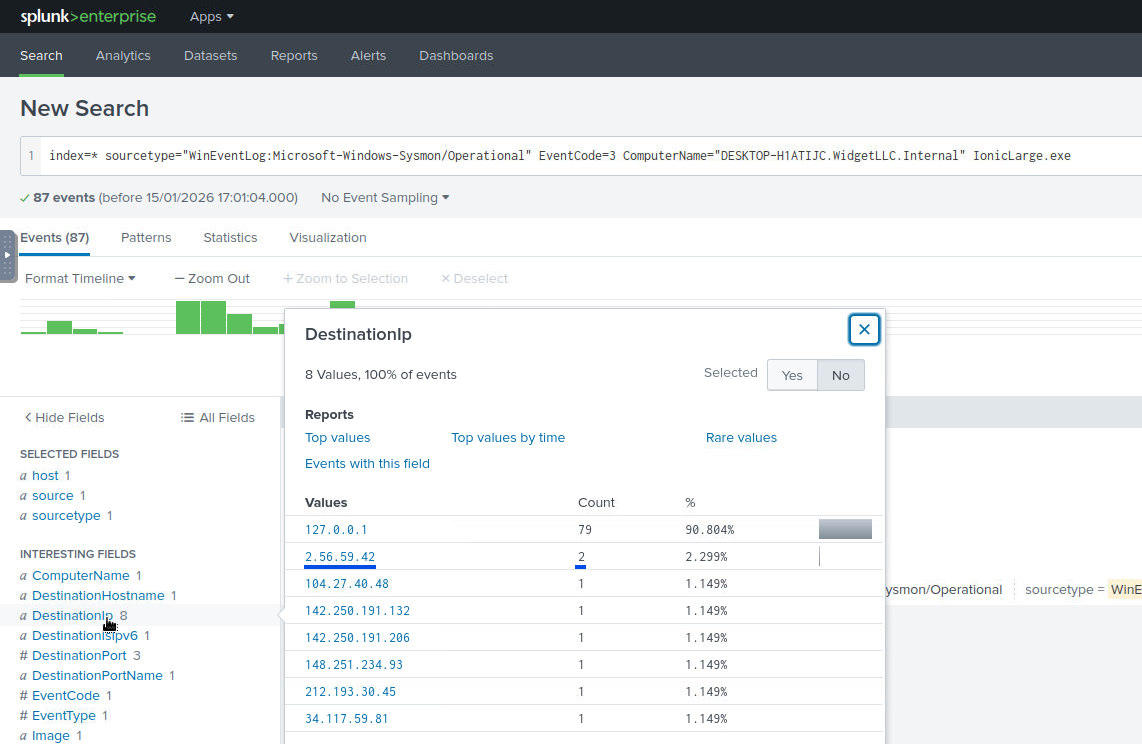
Process: continued investigating the Sysmon logs, this time searching for EventCode=3, which corresponds to network connection events.
I filtered by the same workstation and included the executable name to locate related network activity.
Inspecting the DestinationIp field revealed an external IP address that received two connections, matching the information provided in the question.
Since the challenge required a defanged IP address, I used CyberChef to convert the IP to the required format.
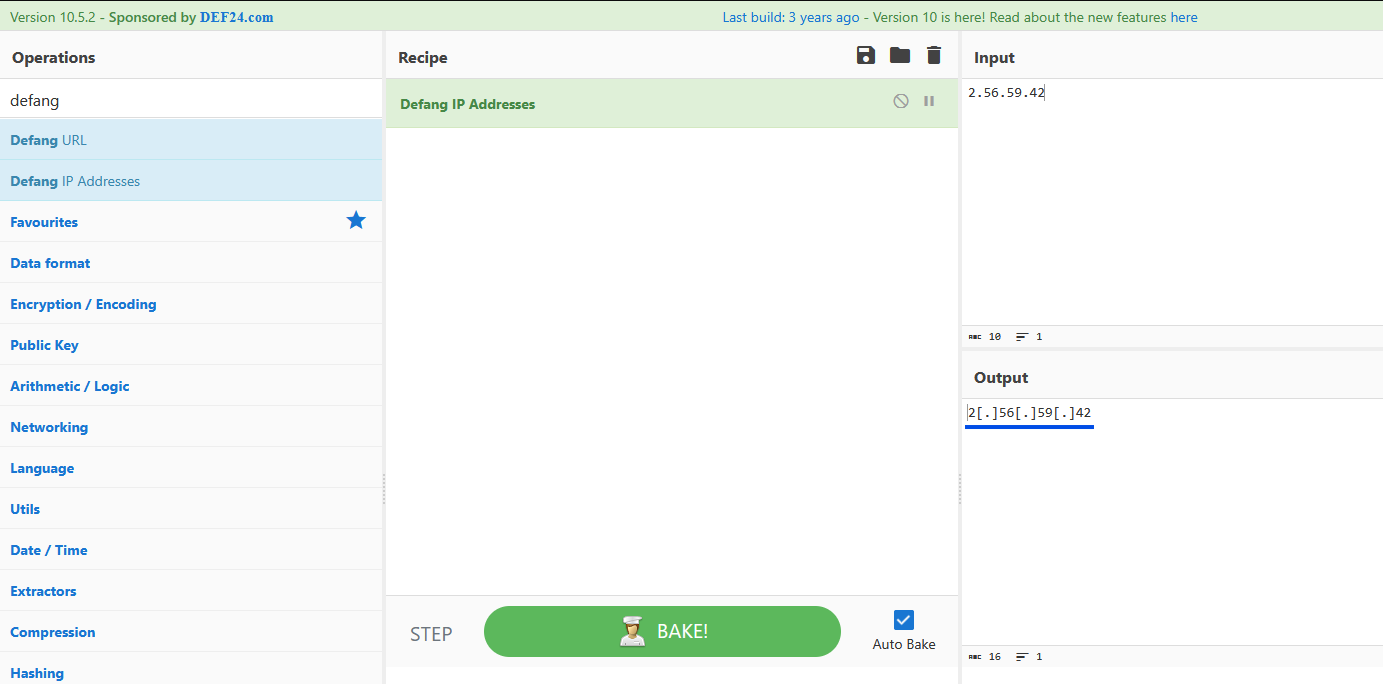
Answer: 2[.]56[.]59[.]42
Process: To identify registry activity, I kept the ComputerName filter and included the malicious binary name IonicLarge.exe.
I then filtered for registry-related Sysmon events:
EventCode IN (12,13,14)
These event IDs correspond to registry key creation, deletion, and modification.
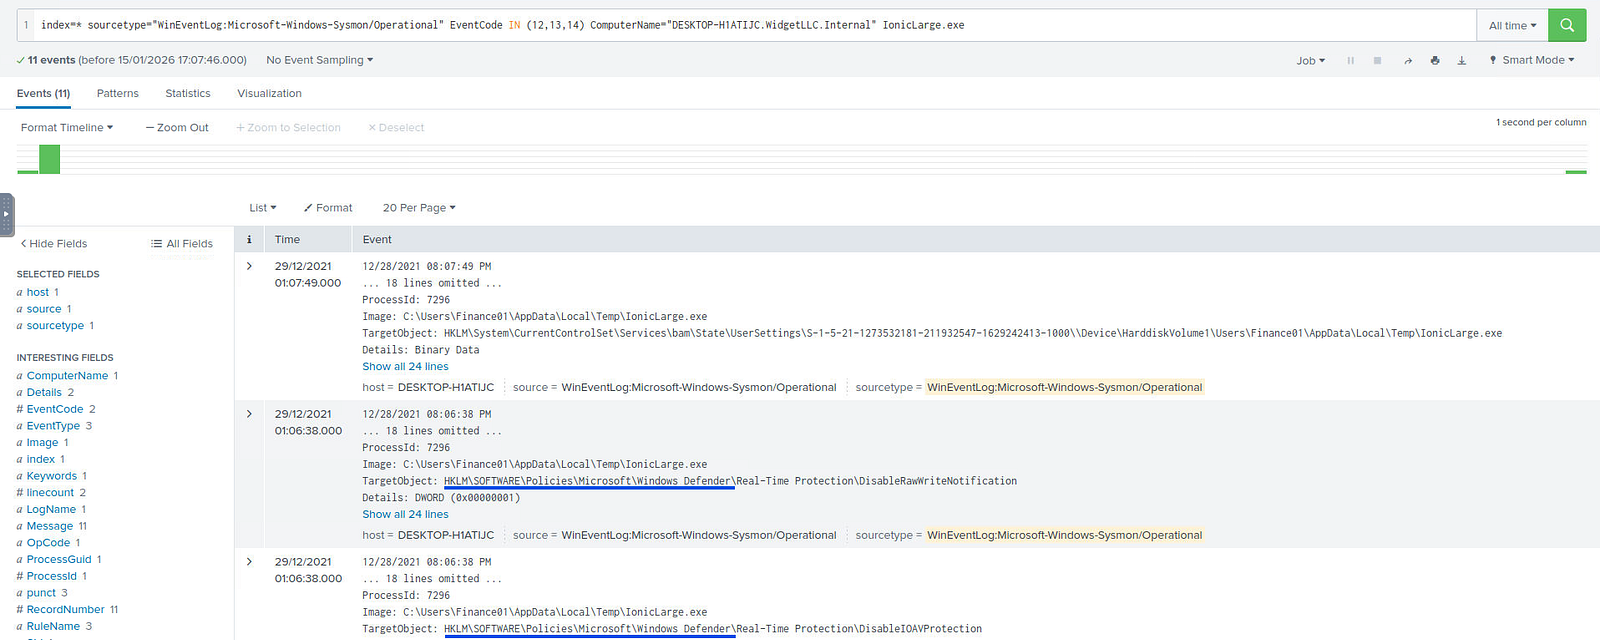
The results revealed several registry modifications related to Windows Defender policies.
Answer: HKLM\Software\Policies\Microsoft\Windows Defender
Process: To identify terminated processes, I searched for events where the Image field referenced the Windows utility Taskkill, which is commonly used to terminate running processes.
After locating the relevant events, I inspected the CommandLine field to determine which processes were terminated using this tool.
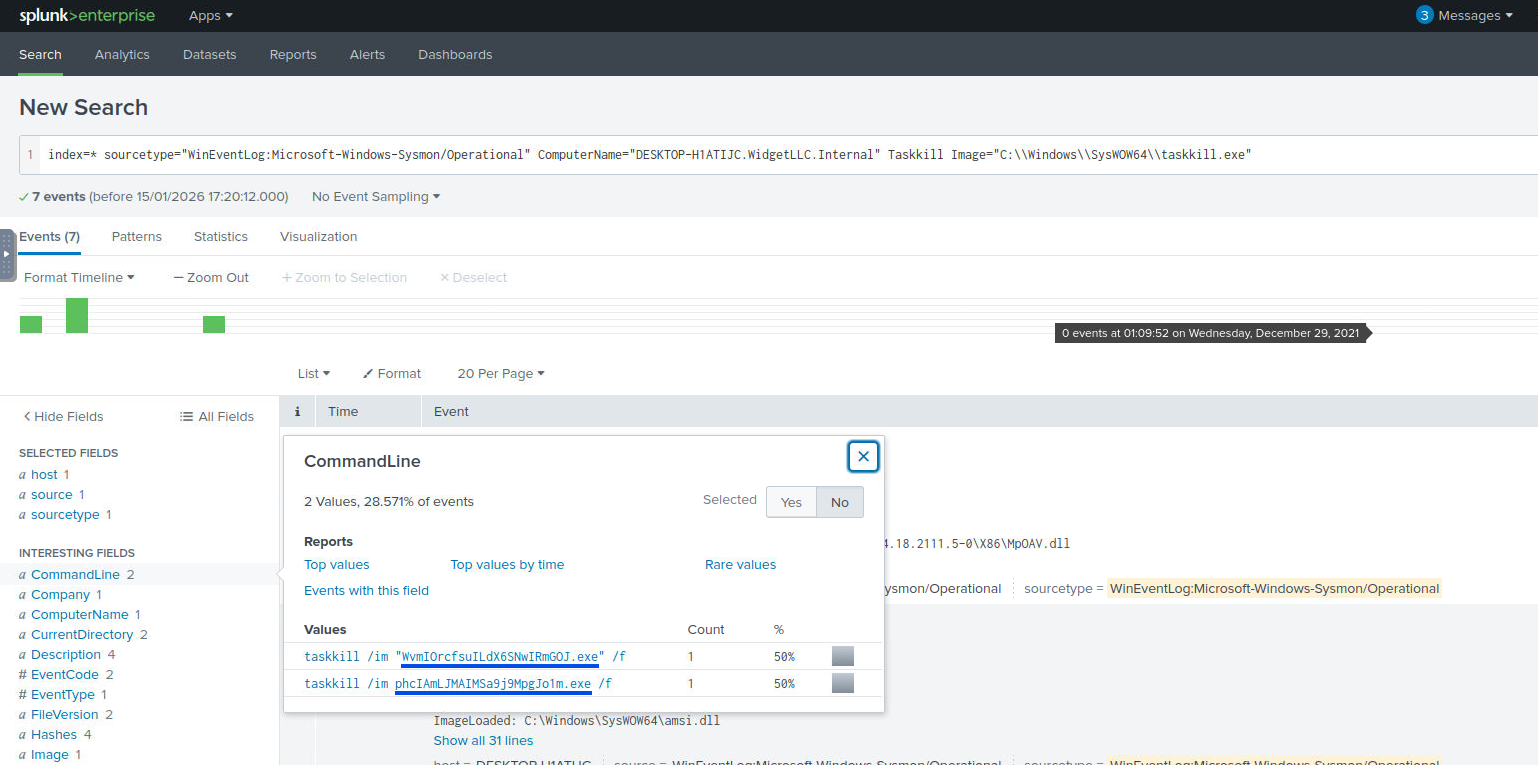
Answer: WvmIOrcfsuILdX6SNwIRmGOJ.exe,phcIAmLJMAIMSa9j9MpgJo1m.exe
Process: I searched using the keyword Defender to retrieve events related to Windows Defender.
I also included CommandLine=* to ensure the results contained command executions.
Since the activity occurred within a PowerShell session, I narrowed the search by filtering the Image field for PowerShell.
To identify the most recent command, I sorted the results by _time in descending order.

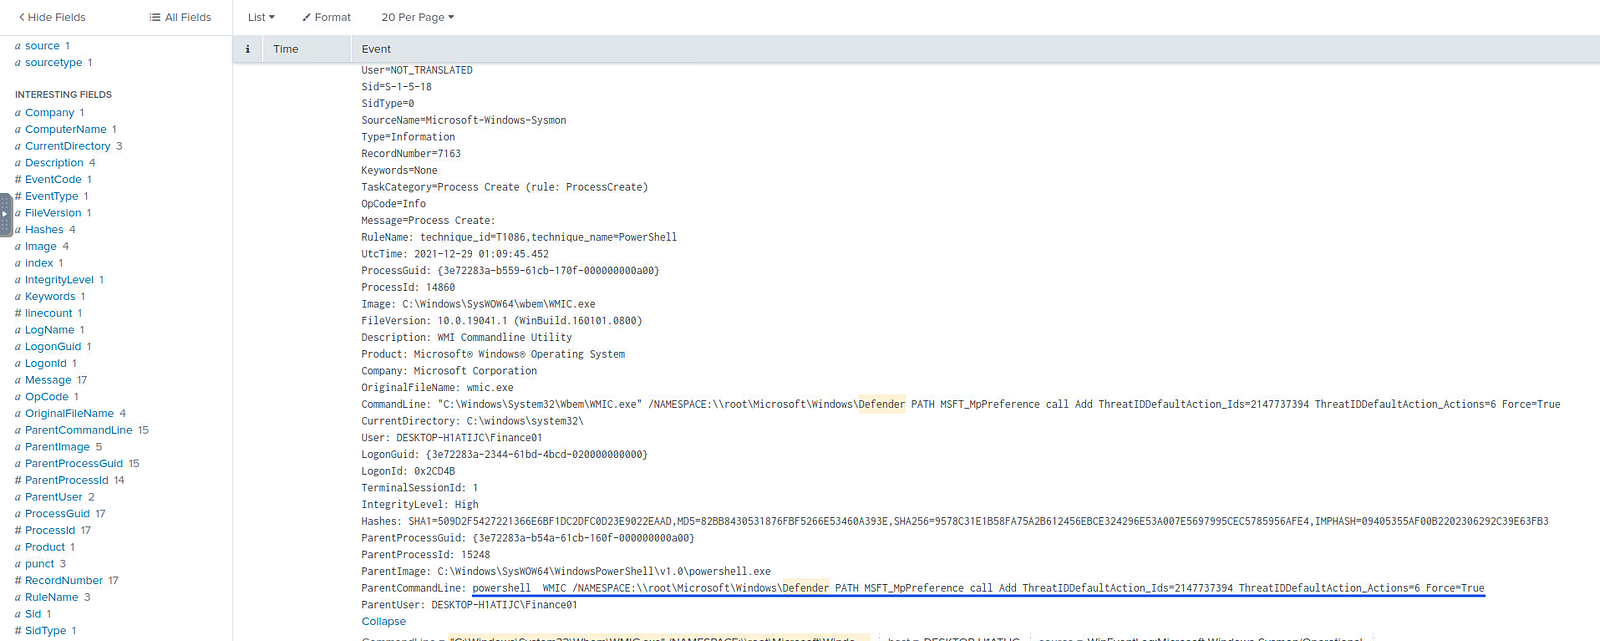
Answer: powershell WMIC /NAMESPACE:\\root\Microsoft\Windows\Defender PATH MSFT_MpPreference call Add ThreatIDDefaultAction_Ids=2147737394 ThreatIDDefaultAction_Actions=6 Force=True
Process:
Using the results from the previous search, I examined the CommandLine field and identified the IDs set within the commands executed by the attacker.
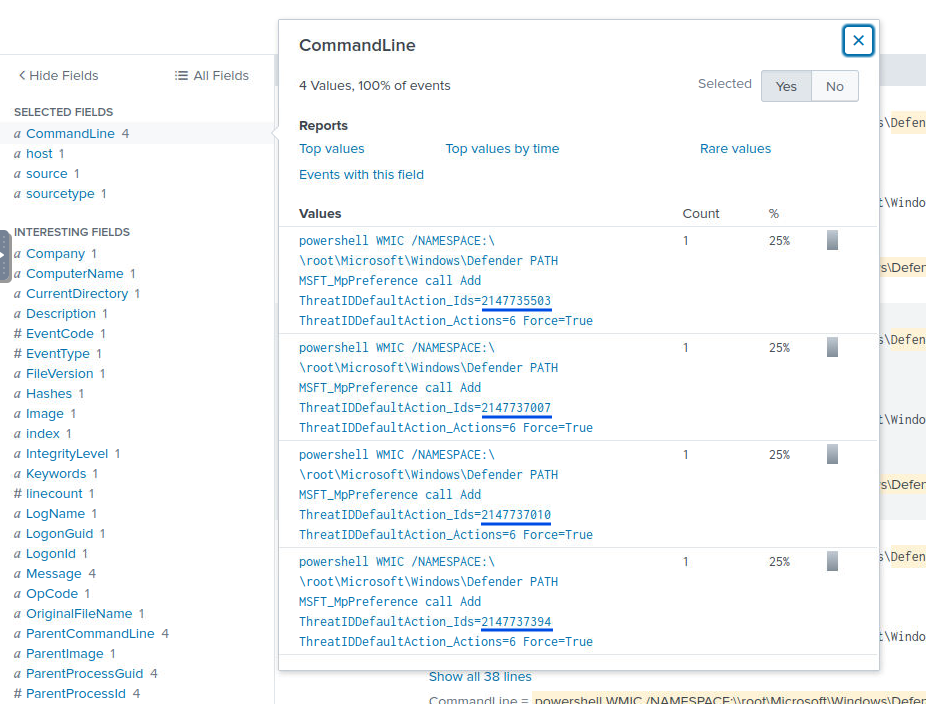
Answer: 2147735503,2147737010,2147737007,2147737394
Process:
Since the question referenced another AppData location, I used AppData as a search keyword.
I then sorted the results to display the most recent events, which could correspond to later stages of the attack.
By examining the Image field, I identified another suspicious executable launched from an AppData directory.
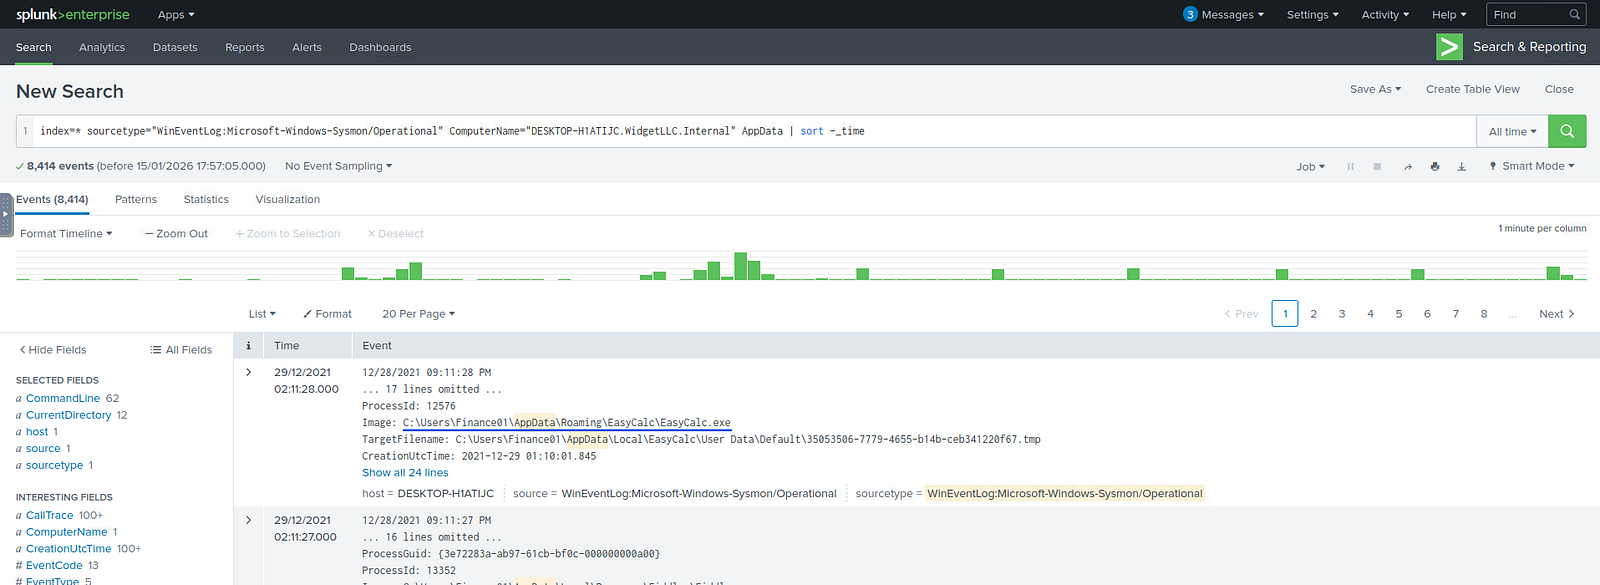
Answer: C:\Users\Finance01\AppData\Roaming\EasyCalc\EasyCalc.exe
Process: To identify DLL activity, I searched using the Image field corresponding to the previously discovered executable.
I then filtered forEventCode=7
Sysmon Event ID 7 records Image Loaded events, which occur when a process loads a DLL or similar module.
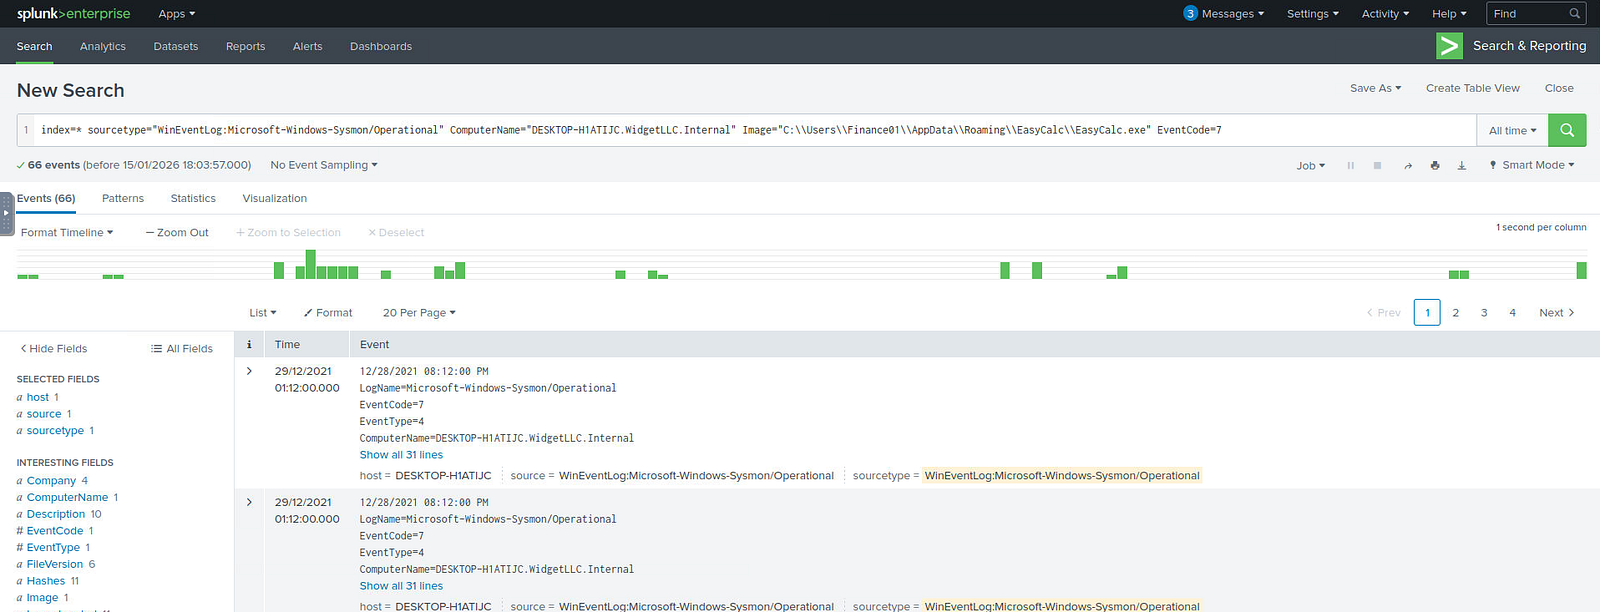
To review the modules loaded by the executable, I examined the ImageLoaded field using top statistics.
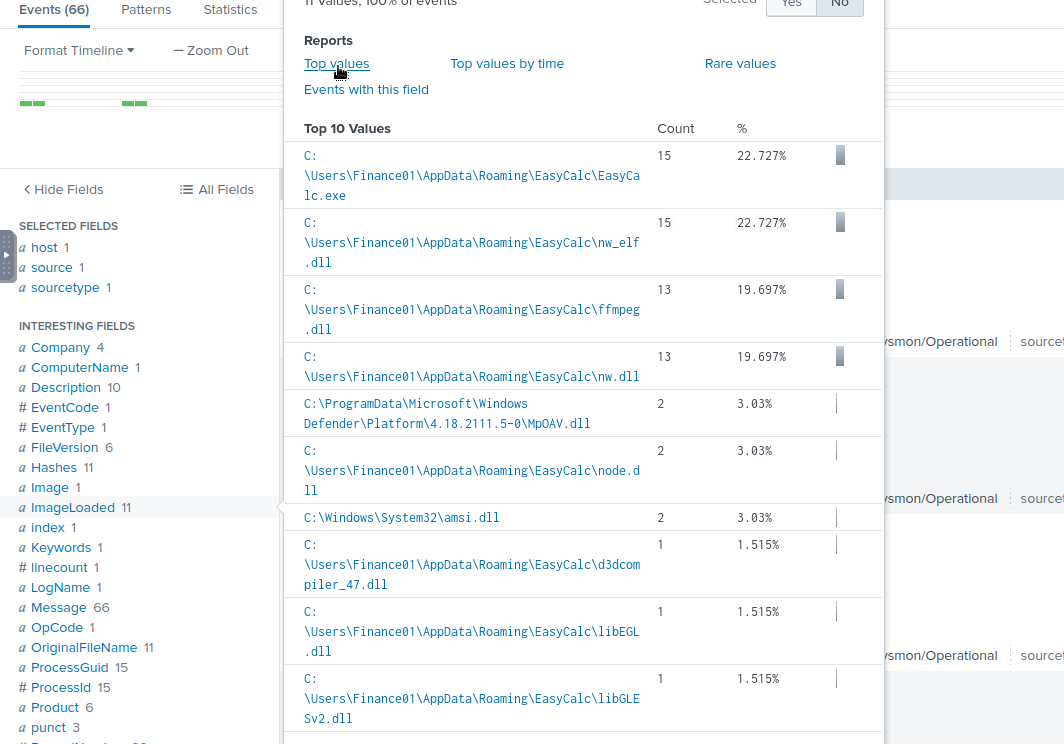
Although the executable loaded more than three DLLs, the three most frequently occurring modules matched the ones required by the challenge.
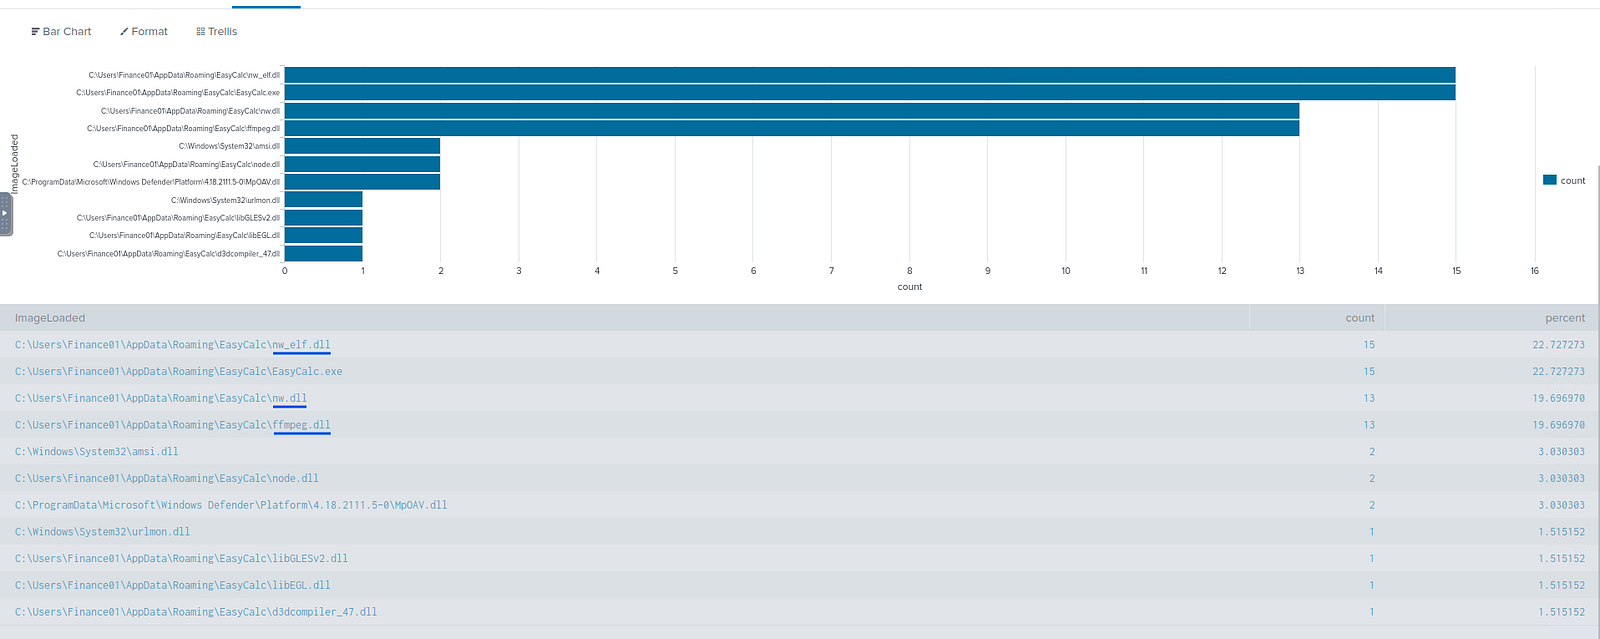
Answer: ffmpeg.dll,nw.dll,nw_elf.dll
Based on the analyzed logs, the attacker activity appears to follow this sequence:
This sequence highlights common attacker techniques such as defense evasion, credential harvesting, and malicious execution from user directories.
This challenge provided a practical scenario for analyzing malicious activity using Sysmon logs and Splunk queries.
By correlating process execution events, network connections, registry modifications, and PowerShell activity, it was possible to reconstruct the attacker’s actions on the compromised workstation.
Exercises like this are valuable for developing the skills required in Security Operations Center (SOC) environments, where analysts must analyze logs and identify indicators of compromise across multiple telemetry sources.
A detection-engineering exercise using Sigma, Splunk, Windows telemetry, and Atomic Red Team to validate vendor-neutral detection logic
How to Validate PowerShell Detections in Splunk with Sysmon, Atomic Red Team, and MITRE ATT&CK
Exploring the new skills, technologies and investigative mindset behind TryHackMe's updated L2 curriculum