



From Splunk to Sigma: Building and Validating Vendor-Neutral Detection Logic
A detection-engineering exercise using Sigma, Splunk, Windows telemetry, and Atomic Red Team to validate vendor-neutral detection logic


In this write-up, I walk through Task 5 of the TryHackMe Detecting Web DDoS room, focusing on how Splunk SIEM can be used to identify and analyze a denial-of-service attack. Each question is answered using Splunk search queries, with a brief explanation of the investigation process behind each result.
Question 1:
What was the most frequently requested uri?
Process:
The query index="main" | top uri immediately returned the most frequently requested URI.
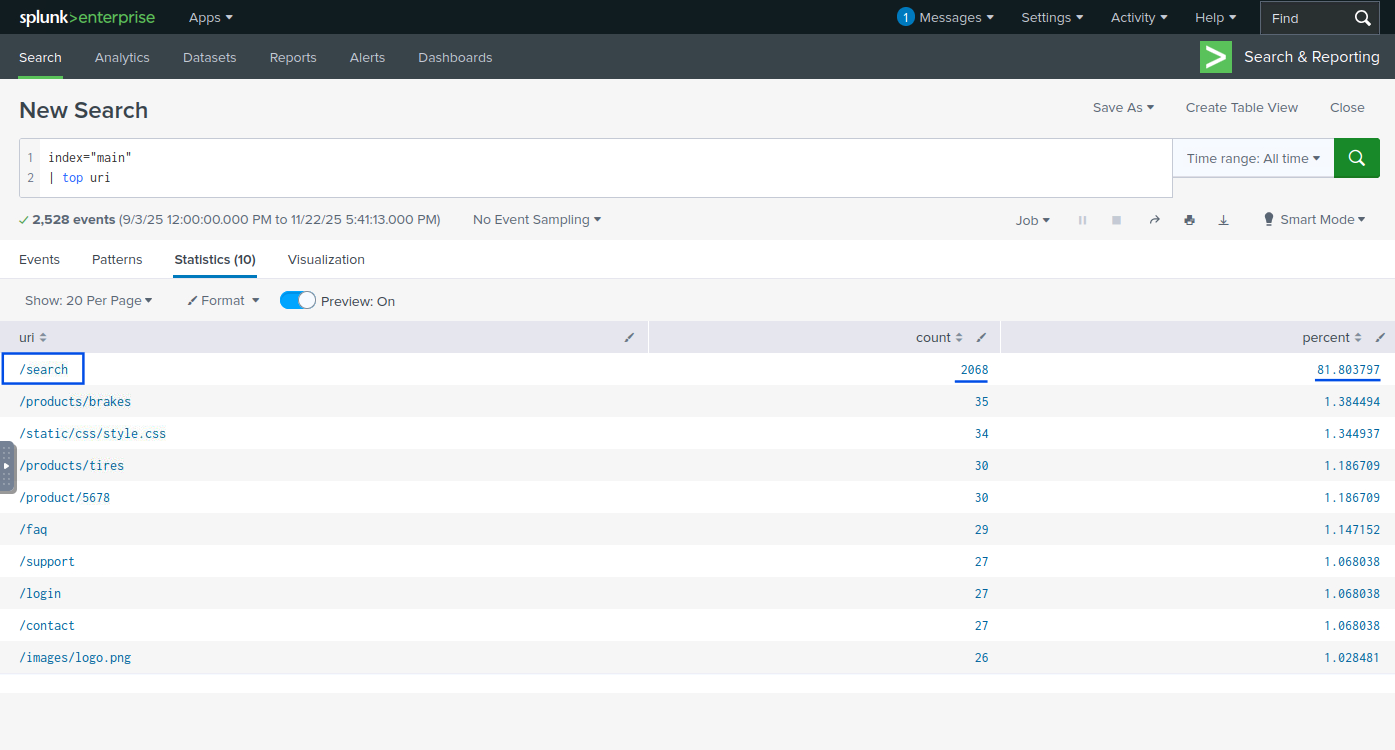
Alternatively, selecting the uri field from the sidebar also displays the top 10 values.
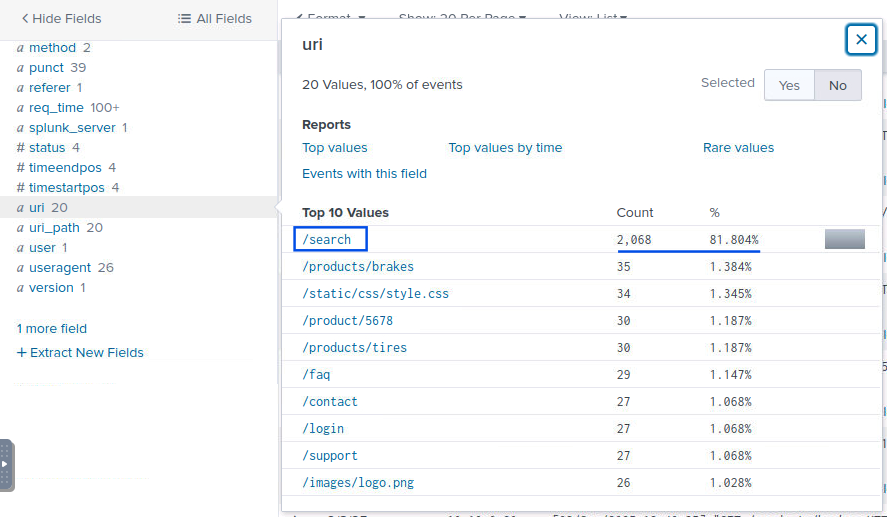
Answer: /search
Question 2:
Which clientip made the most requests to the target uri?
Process:
The query index="main" | top clientip immediately returned the IP address that made the most requests.
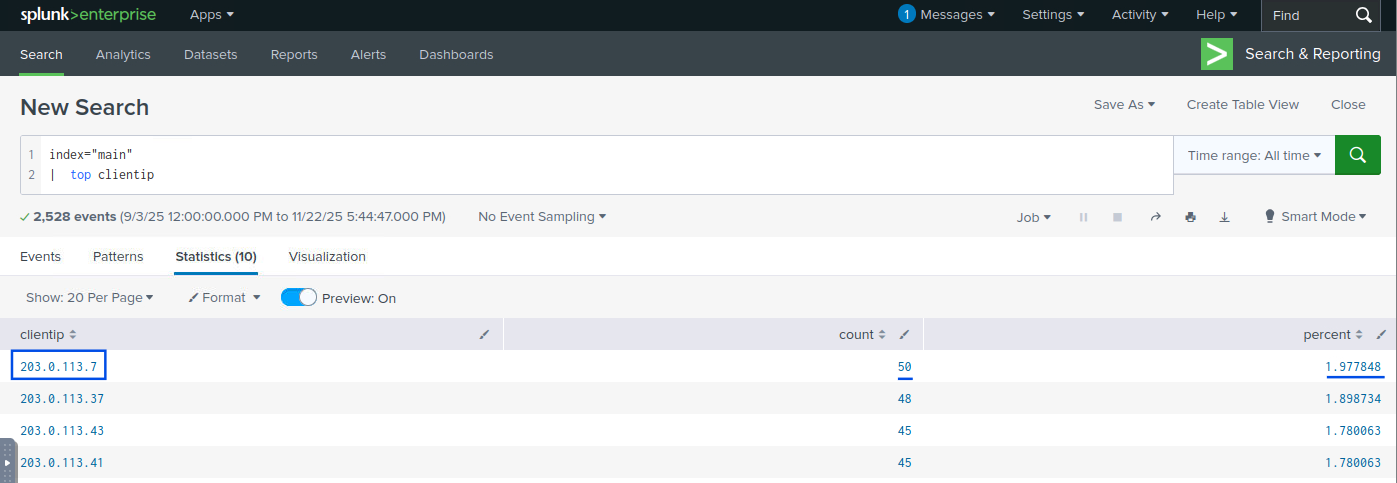
Alternatively, selecting the clientip field from the sidebar also displays the top 10 values.
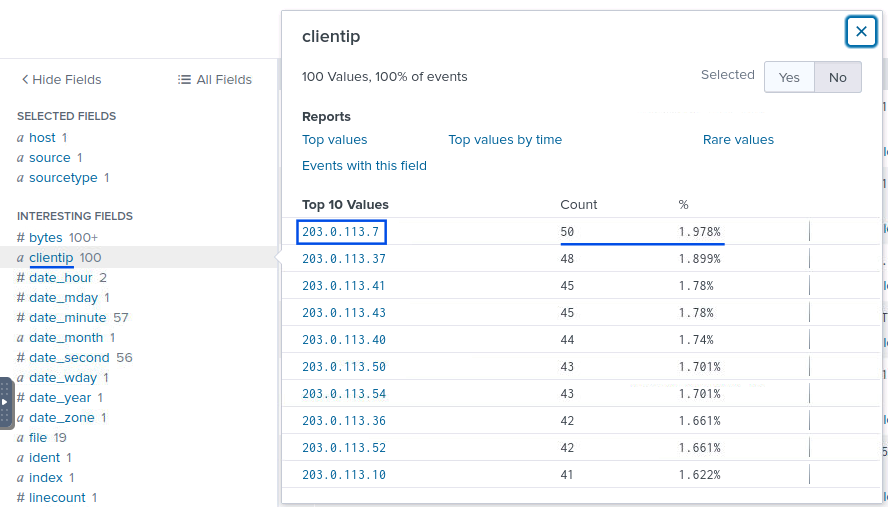
Answer: 203.0.113.7
Question 3:
How many IP addresses were part of the botnet that attacked your website?
Process:
I started by filtering all IPs that requested the suspected attack URI: uri="/search".
I observed that all these IP addresses had a high number of requests and belonged to the same subnet, sharing the same first three octets. Based on this observation, I filtered the IP range using clientip="203.0.113.*".
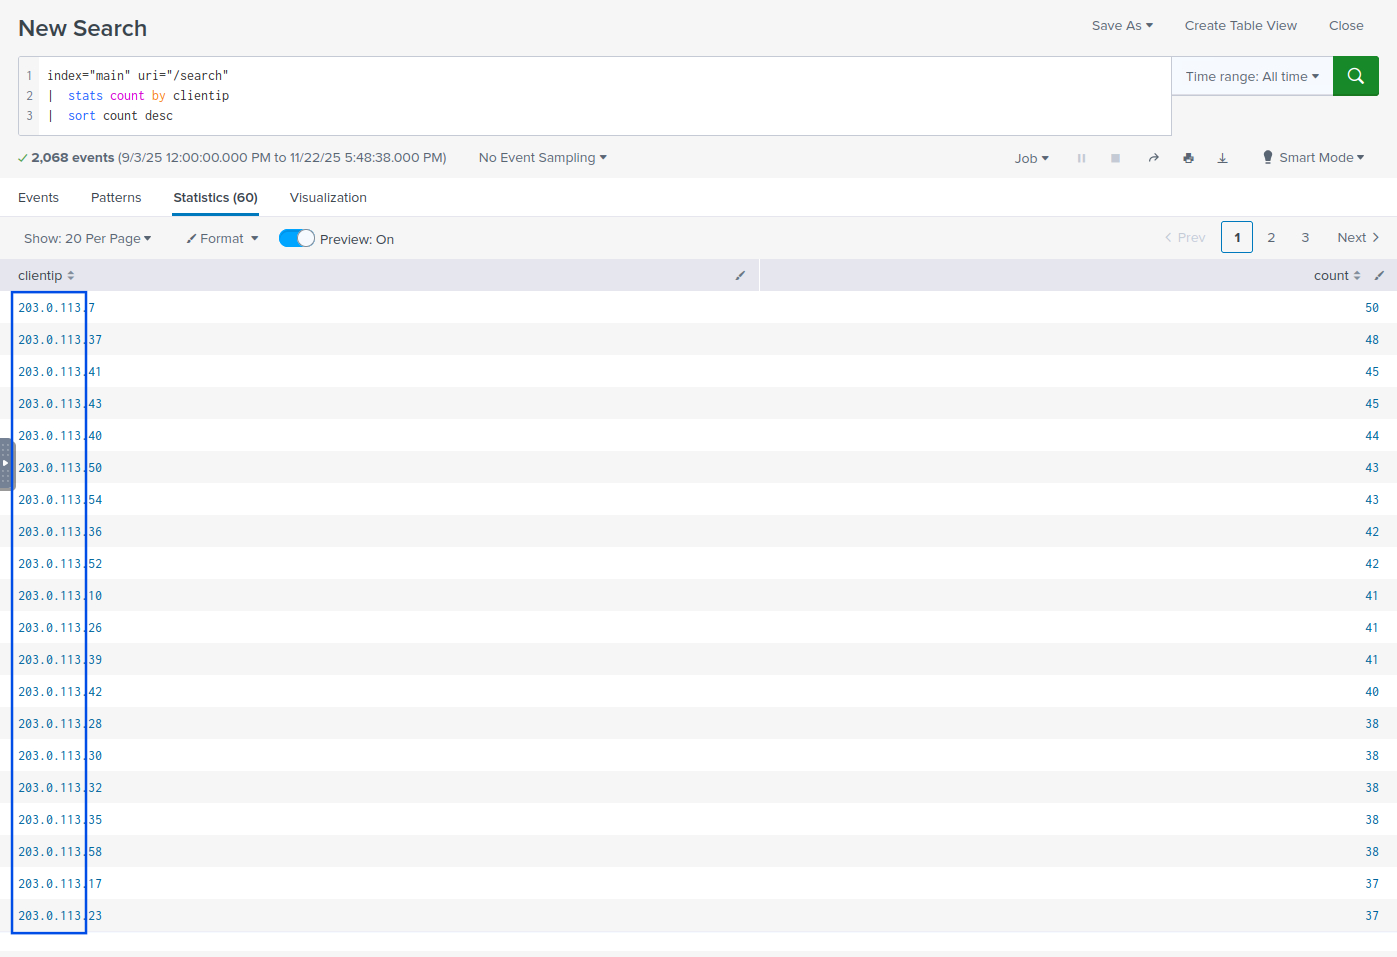
Next, I created a table containing only the clientip field, removed duplicate values, and counted the remaining unique IPs.
index="main" uri="/search" clientip="203.0.113.*"
| table clientip
| dedup clientip
| stats count
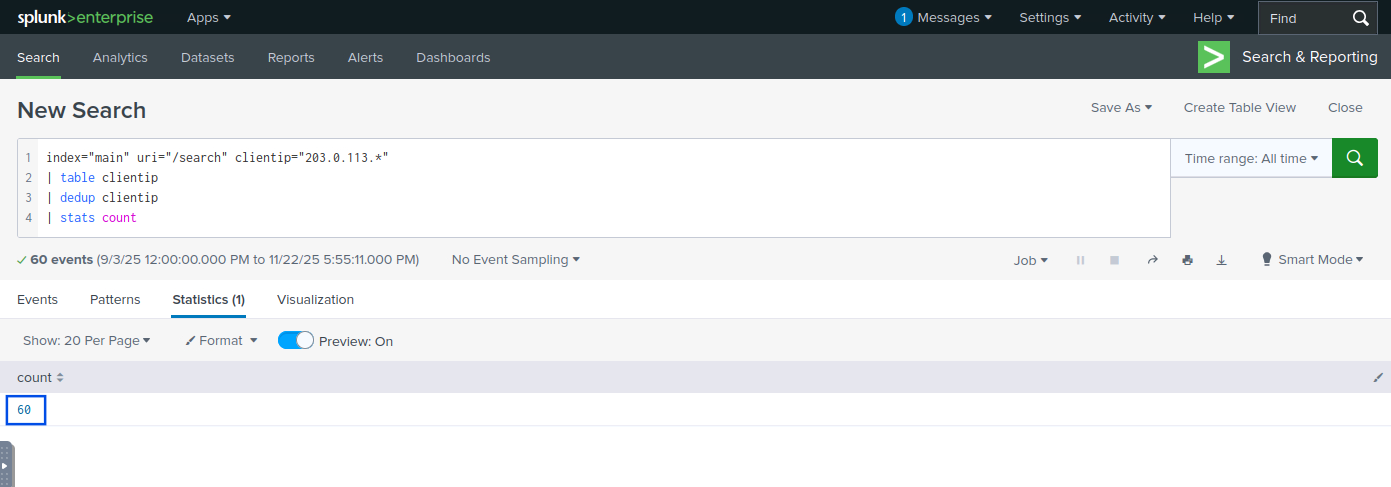
Answer: 60
Question 4:
Which useragent was most commonly used by the attacking traffic?
Process:
I filtered events involving the malicious IP range accessing the abused resource and then displayed the most common user agents using the top command.
index="main" uri="/search" clientip="203.0.113.*"
| top useragent
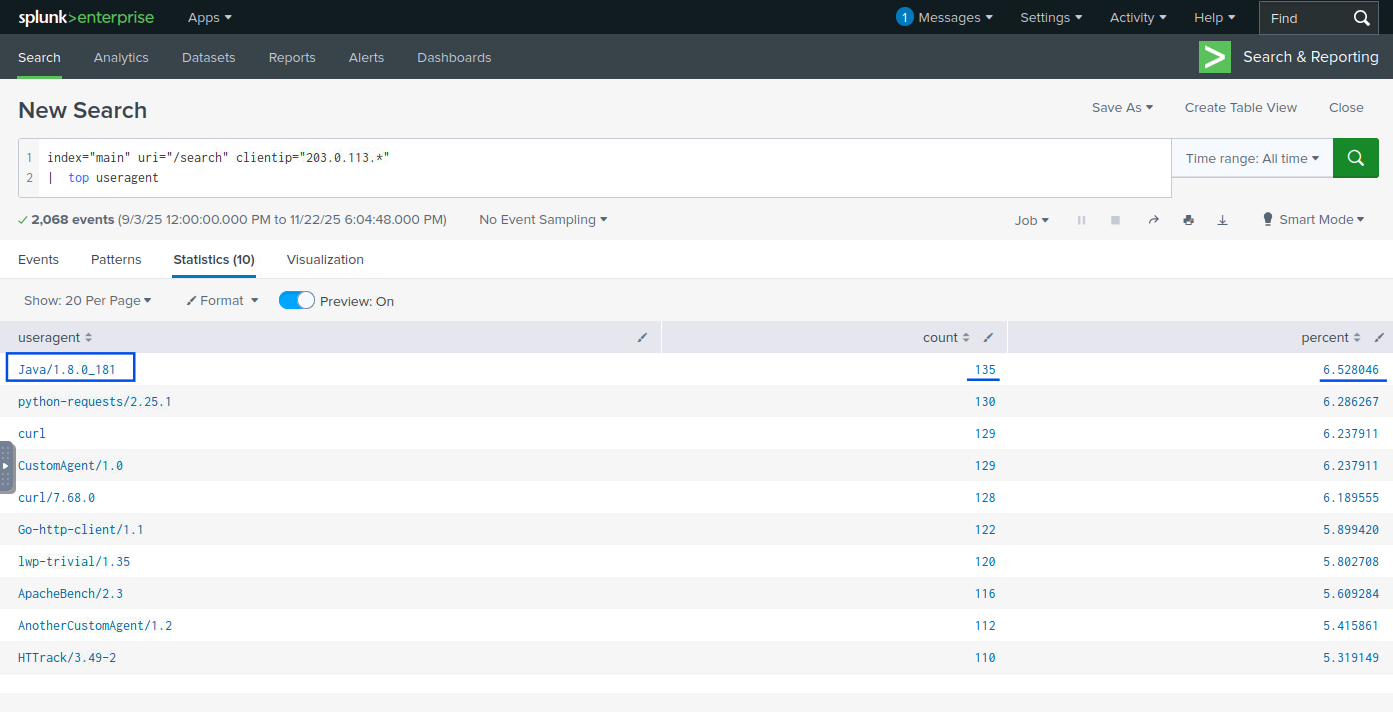
Answer: Java/1.8.0_181
Question 5:
Use the timechart command to visualize the requests.
What is the peak number of requests made per second during the attack?
Process:
I used the timechart command with a one-second span to visualize the request volume over time.
index="main" uri="/search" clientip="203.0.113.*"
| timechart span=1 count by request
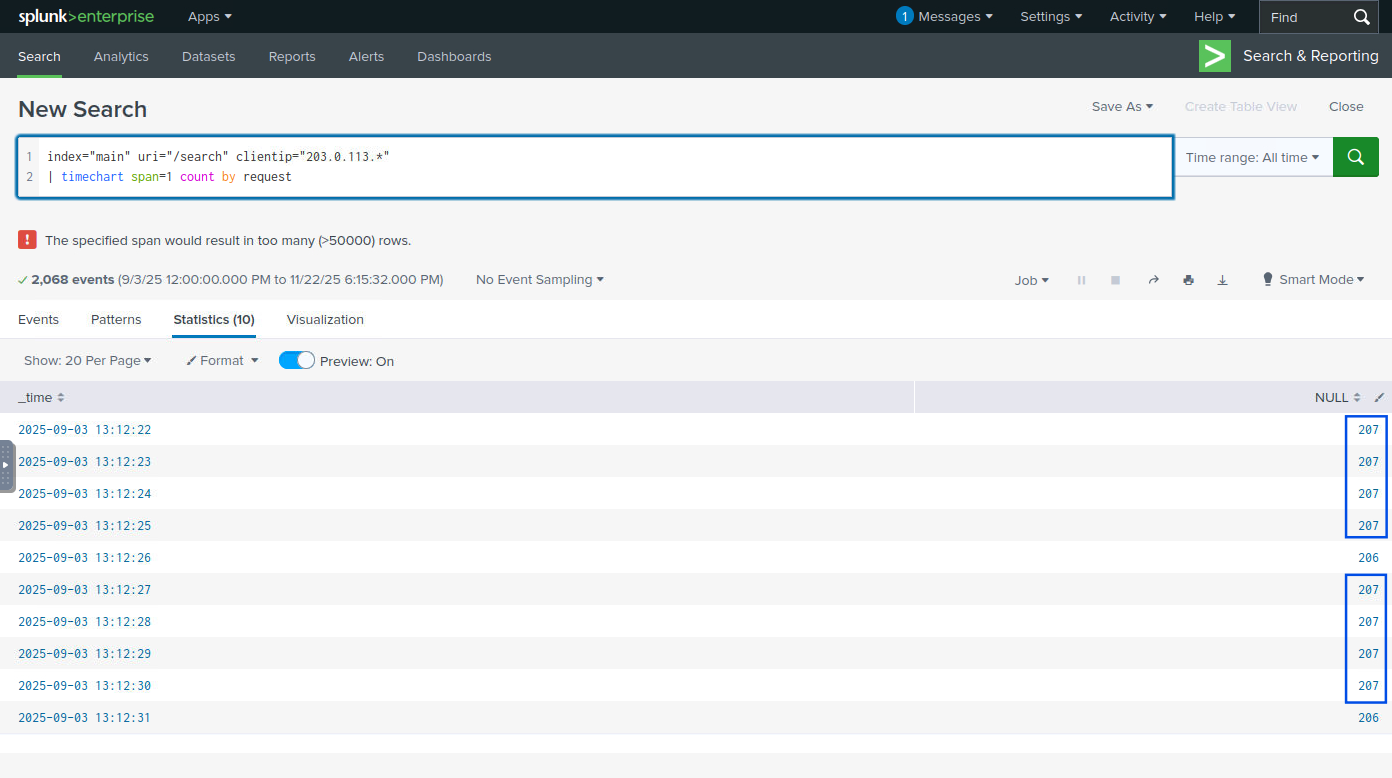
Answer: 207
Question 6:
Which legitimate (non-attacking) clientip received the first 503 response status post-attack?
Process:
I excluded the attacking IP range, filtered for 503 status codes, and sorted the results by time in ascending order to identify the first affected legitimate client.
index="main" clientip!="203.0.113.*" status="503"
| table _time, clientip, uri
| sort _time asc
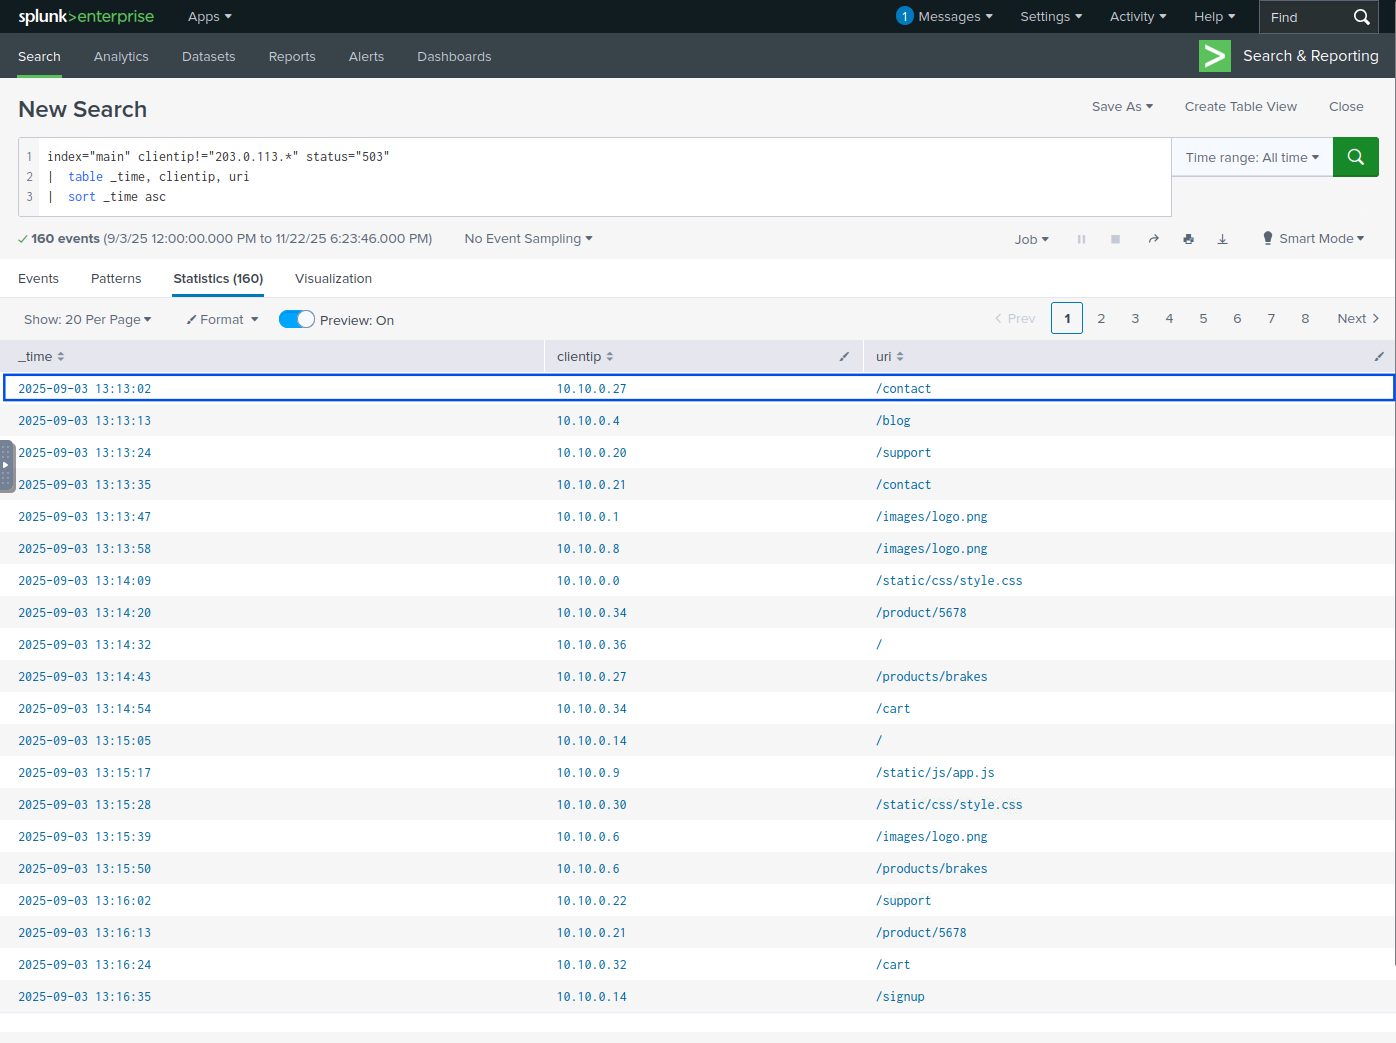
Answer: 10.10.0.27
This exercise demonstrates how Splunk’s search and visualization capabilities can be effectively used to identify DDoS activity, isolate malicious traffic, and assess its impact on legitimate users. By combining filtering, aggregation, and time-based analysis, it becomes possible to quickly detect attack patterns and support incident response efforts in real-world environments.
A detection-engineering exercise using Sigma, Splunk, Windows telemetry, and Atomic Red Team to validate vendor-neutral detection logic
How to Validate PowerShell Detections in Splunk with Sysmon, Atomic Red Team, and MITRE ATT&CK
Exploring the new skills, technologies and investigative mindset behind TryHackMe's updated L2 curriculum