



From Splunk to Sigma: Building and Validating Vendor-Neutral Detection Logic
A detection-engineering exercise using Sigma, Splunk, Windows telemetry, and Atomic Red Team to validate vendor-neutral detection logic


Understanding how to investigate network intrusions is a core skill for security analysts, and Splunk provides powerful capabilities for analyzing perimeter logs at scale. In this scenario, you examine firewall events, intrusion detection alerts, and VPN authentication logs to uncover reconnaissance, intrusion attempts, and potential lateral movement within a corporate network. By correlating activity across DHCP, WAF, IDS, and VPN sources, you can reconstruct an attacker’s path and identify whether the perimeter was effectively breached.
This walkthrough demonstrates how targeted Splunk queries and log interpretation can reveal adversary behavior, highlight weak points in a network, and support incident response decisions.
Initech Corp, a mid-sized financial services company, has recently deployed a new firewall and intrusion detection system (IDS) to monitor its network perimeter. Over the past month, security analysts have noticed abnormal traffic patterns, but the SOC team has been overwhelmed and missed deeper analysis.
As a new security analyst, you have been tasked with reviewing one month of perimeter logs to determine what techniques the adversary used, and whether they succeeded in breaching the perimeter.
You have been given three sets of logs from the time of the incident. The logs can be found in the Perimeter_logs/challenge directory on the Desktop.
firewall.logids_alerts.logvpn_auth.logNetwork Assets
The Network of Initech Corp contains the following assets. We can use that as a reference.
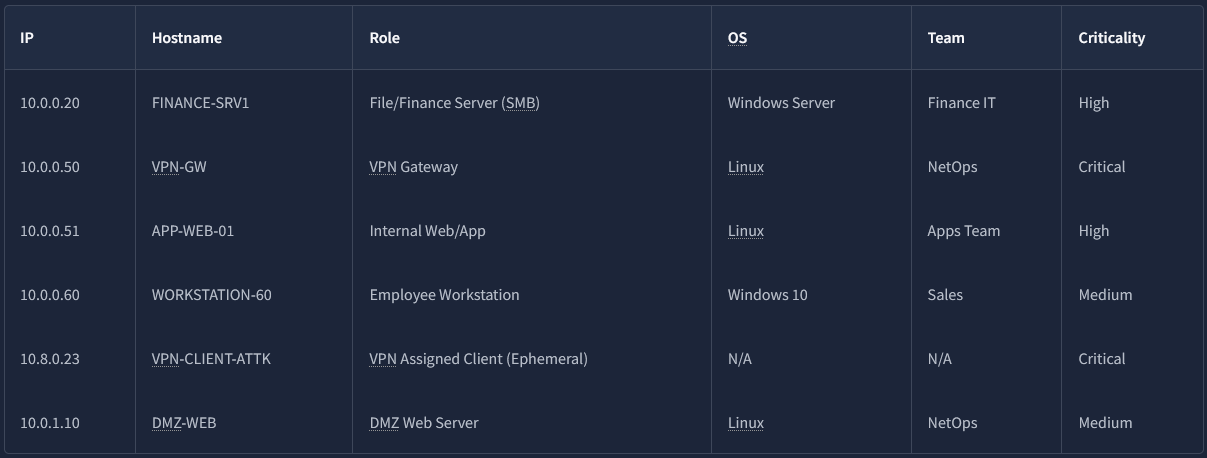
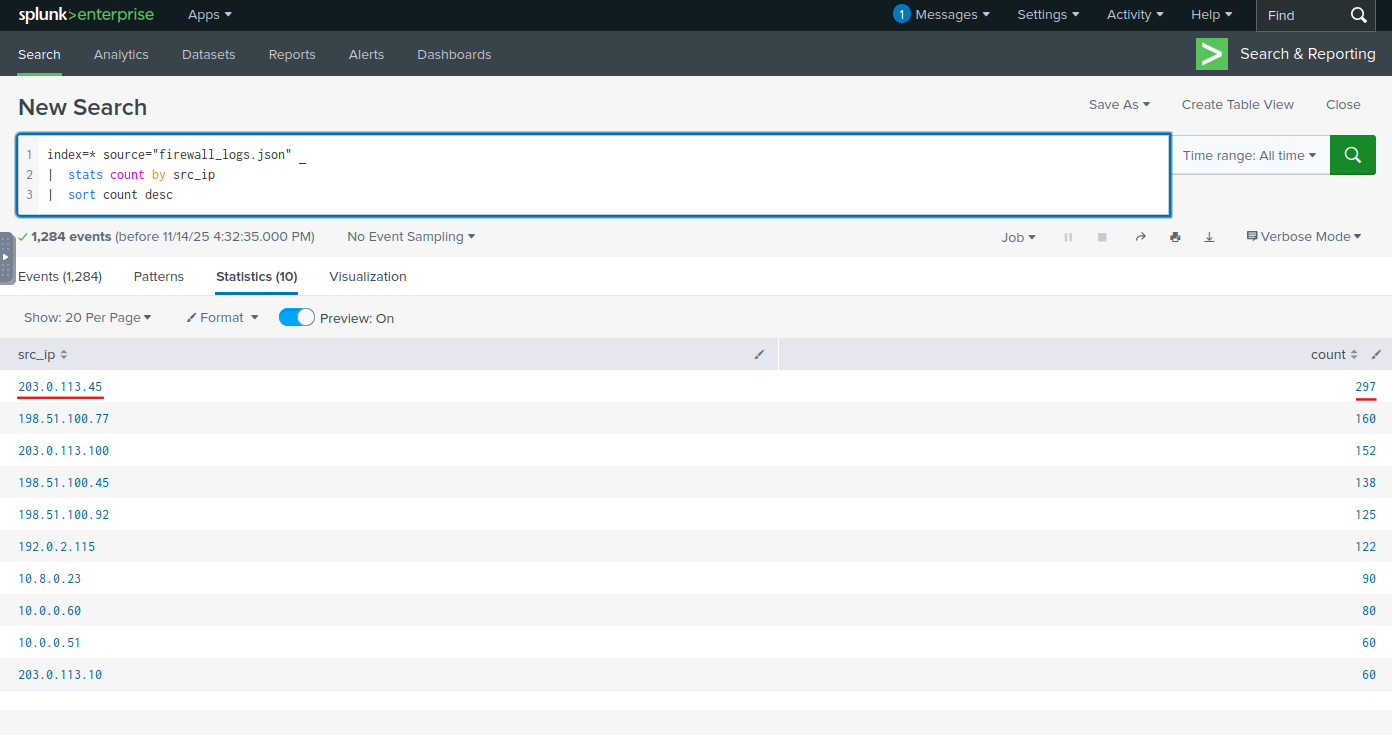
Examine the firewall logs. What external IP performed the most reconnaissance?
Process:
Looking for the source IP with the highest amount of traffic activity led me to results identifying one IP with significantly higher activity than the others.
index=* source="firewall_logs.json" | stats count by src_ip | sort count desc
Answer:
203.0.113.45
In the firewall log, which internal host was targeted by scans?
Process:
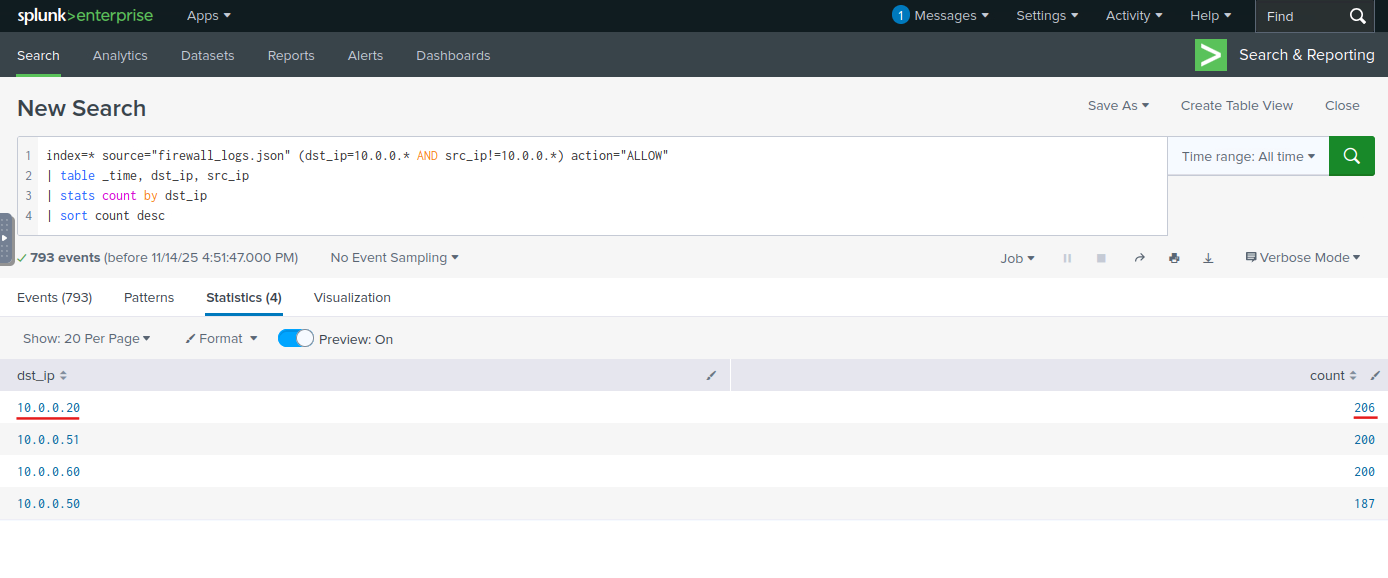
I filtered destination IPs to match the internal subnet using the first three octets and a wildcard. To ensure I captured only external scanning attempts, I excluded any traffic whose source IP belonged to the internal network. Since the question referred to targeted hosts, I limited the results to firewall-allowed connections.
index=* source="firewall_logs.json" (dst_ip=10.0.0.* AND src_ip!=10.0.0.*) action="ALLOW" | table _time, dst_ip, src_ip | stats count by dst_ip | sort count desc
Answer:
10.0.0.20
Which username was targeted in VPN logs?
Process:
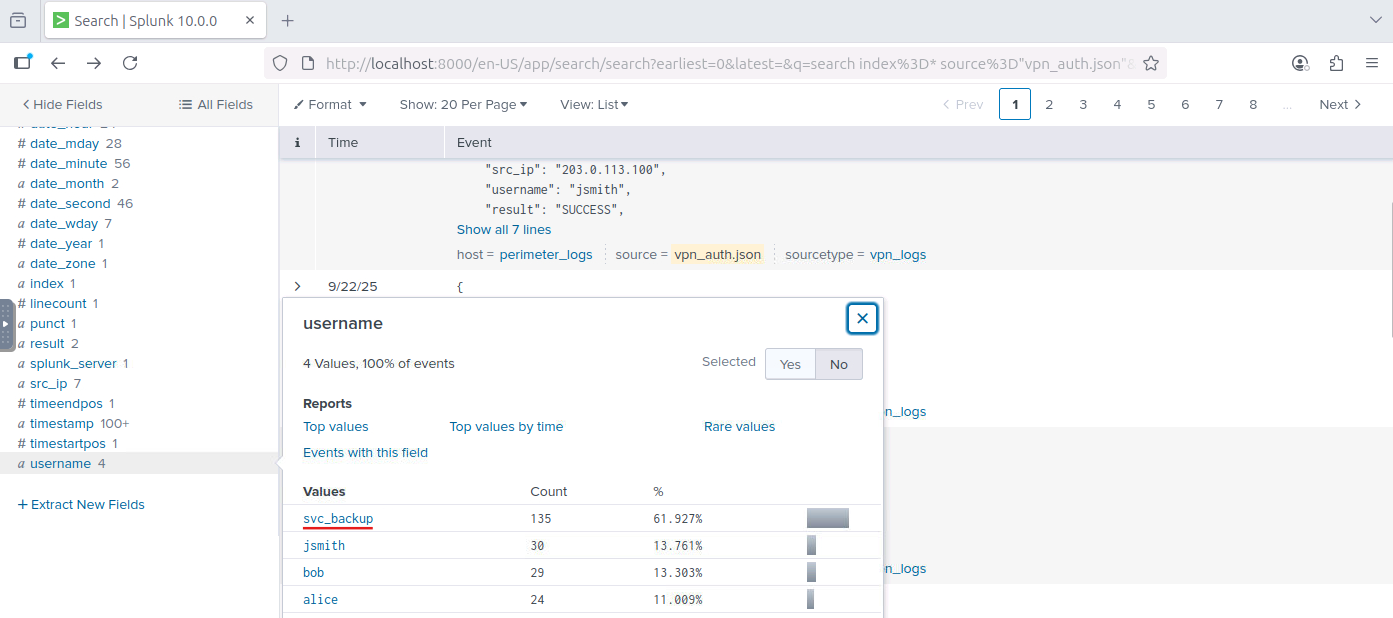
I reviewed the VPN logs and, after checking the top username values, I noticed that one of them showed significantly higher activity than the others.
index=* source="vpn_auth.json"
Answer:
svc_backup
What internal IP was assigned after successful VPN login?
Process:
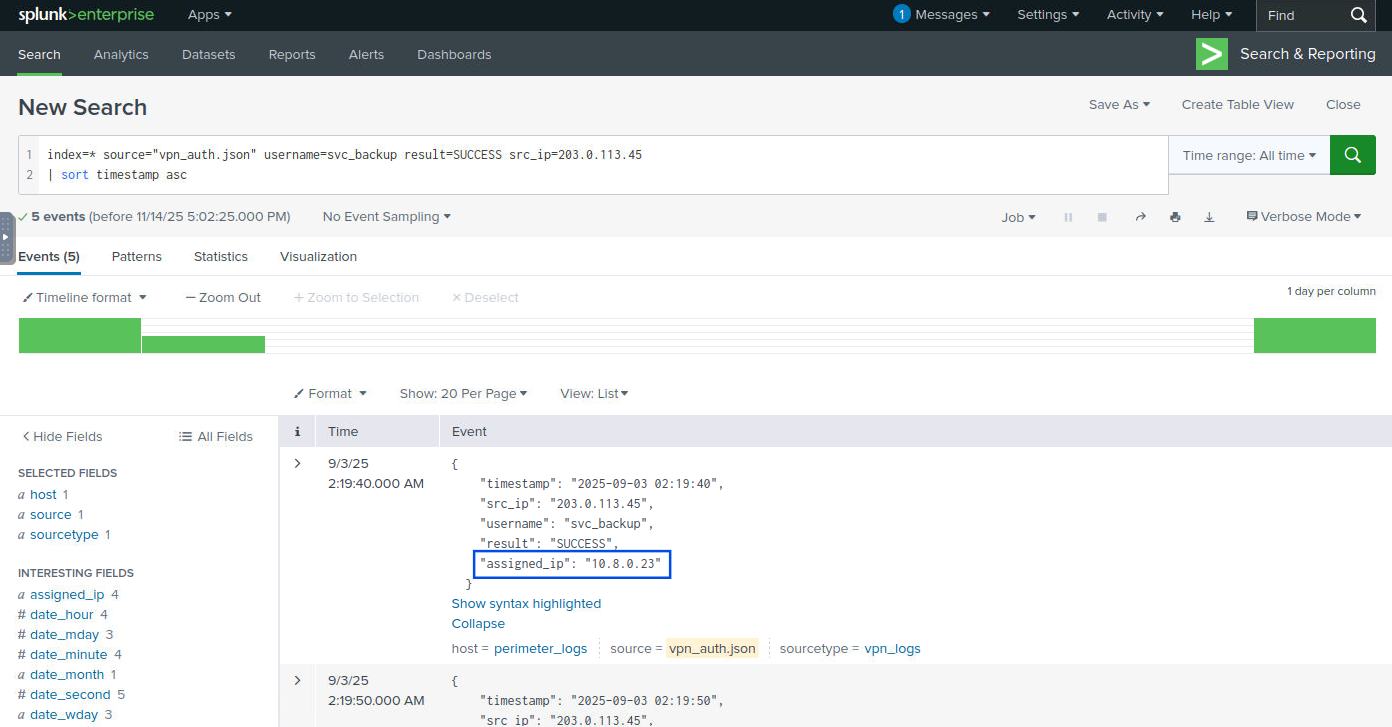
I queried the VPN logs for the targeted username and restricted the results to successful authentication attempts from the attacker’s external IP. After sorting the logs by timestamp, I identified the internal IP assigned following the successful login.
index=* source="vpn_auth.json" username=svc_backup result=SUCCESS src_ip=203.0.113.45 | sort timestamp asc
Answer:
10.8.0.23
Which port was used for lateral SMB attempts?
Process:
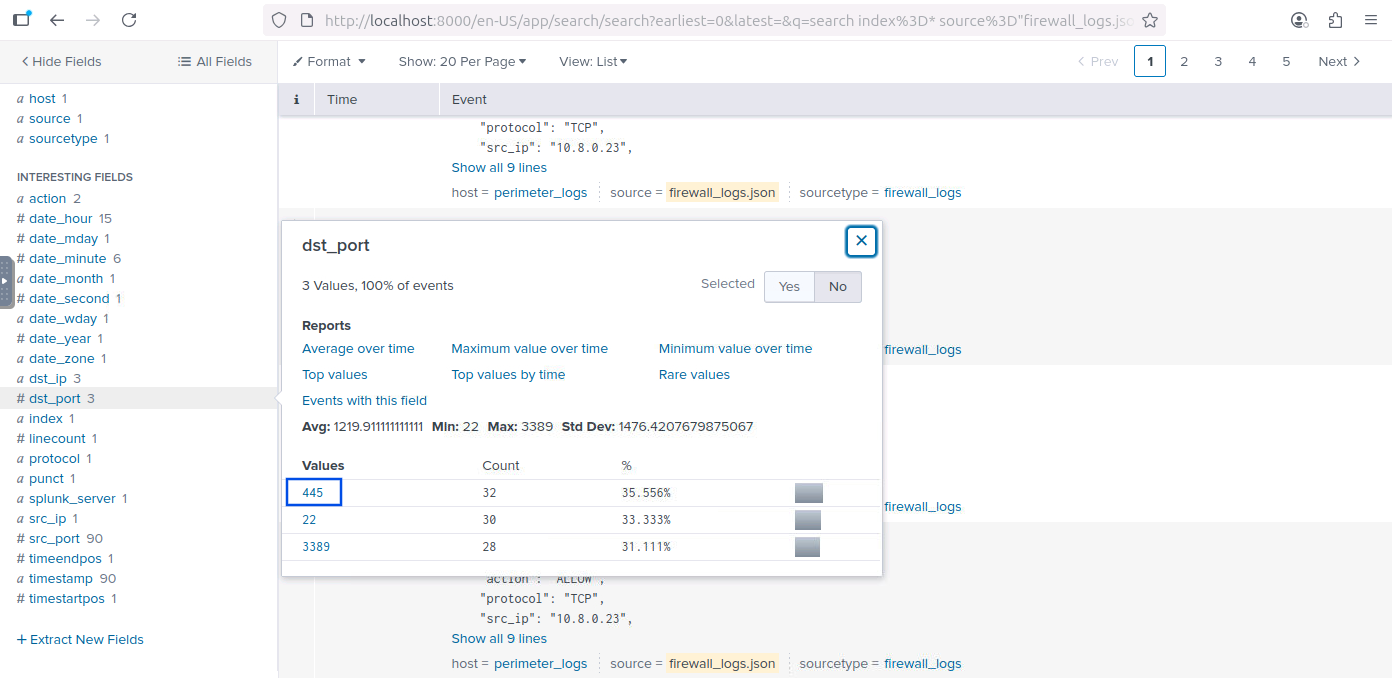
Having the assigned IP inside the corporate network, I could go back to the firewall logs and check for the destination ports used by the attacker. The most used turned out to be 445, which is the common port for SMB connections.
index=* source="firewall_logs.json" src_ip="10.8.0.23"
Answer:
445
In the IDS logs, which host beaconed to the C2?
Process:
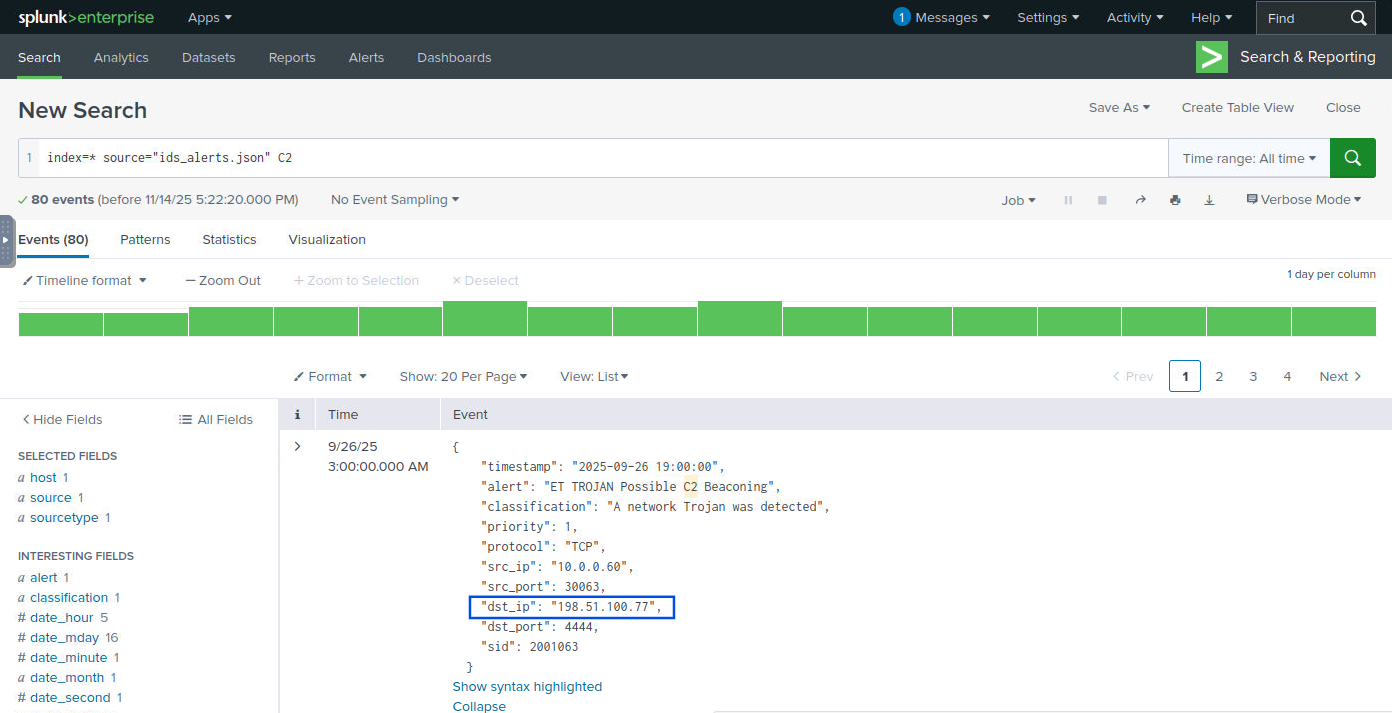
index=* source="ids_alerts.json" C2
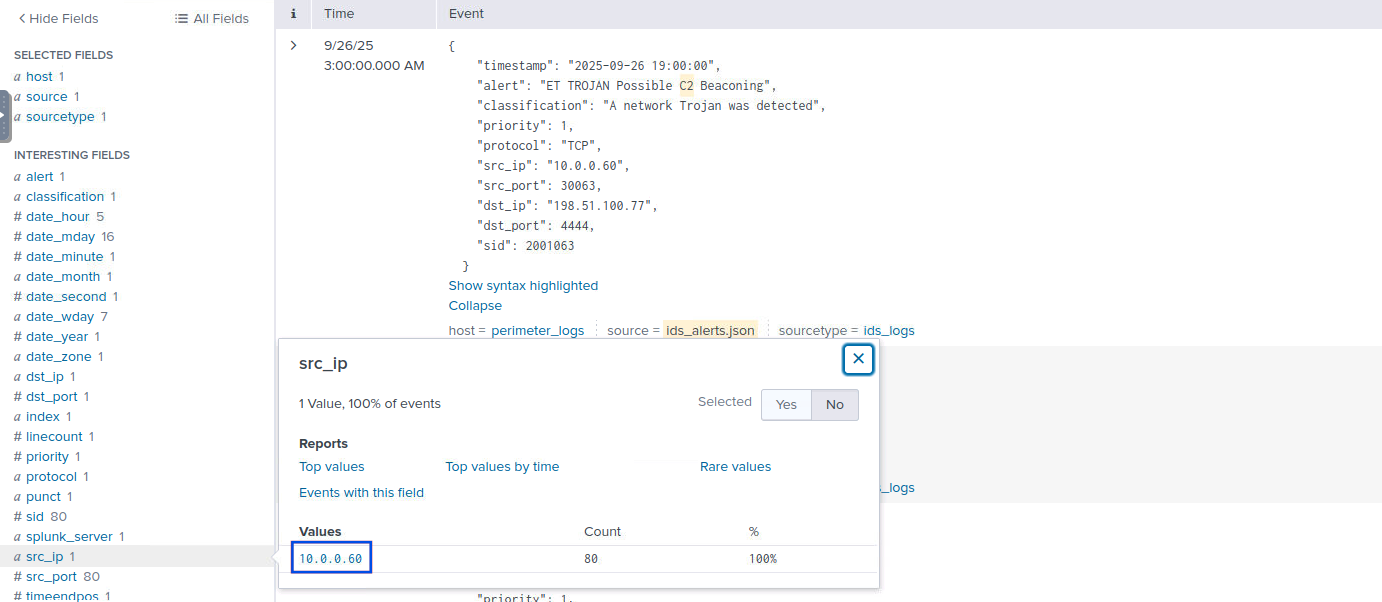
Doing a search for the word C2 showed all alerts containing the message "alert": "ET TROJAN Possible C2 Beaconing". Checking the results for src_ip revealed the host that was beaconing.
Answer:
10.0.0.60
During the investigation, which IP was observed to be associated with C2?
Process:
Checking the same alerts from the previous question, I could see the IP associated with C2 by checking the destination IP.
Answer:
198.51.100.77
Which host showed the exfiltration attempts?
Process:
First, I searched for connections involving the C2 IP:
index=* source="ids_alerts.json" dst_ip="198.51.100.77"
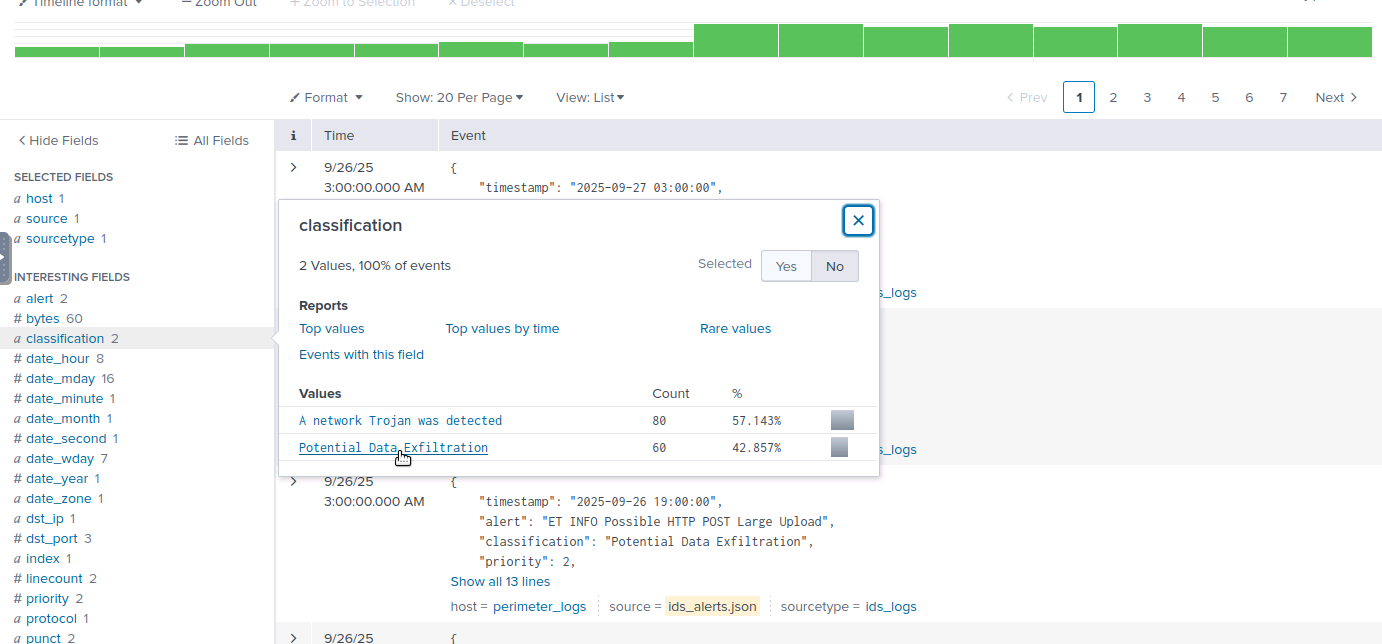
Then I filtered the results by the classification “Potential Data Exfiltration”:
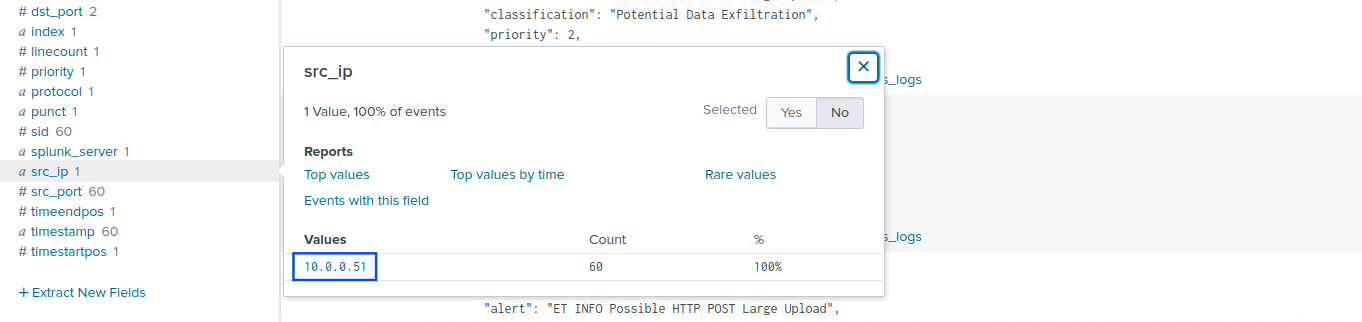
index=* source="ids_alerts.json" dst_ip="198.51.100.77" classification="Potential Data Exfiltration"
All source IPs pointed to 10.0.0.51.
Answer:
10.0.0.51
This investigation demonstrates how Splunk can be used to trace an attacker’s activity across multiple perimeter log sources. By correlating reconnaissance, authentication attempts, beaconing behavior, and potential data exfiltration, analysts can piece together a clear picture of an intrusion. Effective log analysis not only uncovers the attacker’s methods but also highlights defensive gaps that can be addressed to strengthen the organization’s security posture.
A detection-engineering exercise using Sigma, Splunk, Windows telemetry, and Atomic Red Team to validate vendor-neutral detection logic
How to Validate PowerShell Detections in Splunk with Sysmon, Atomic Red Team, and MITRE ATT&CK
Exploring the new skills, technologies and investigative mindset behind TryHackMe's updated L2 curriculum